
Image
|
Figure Caption
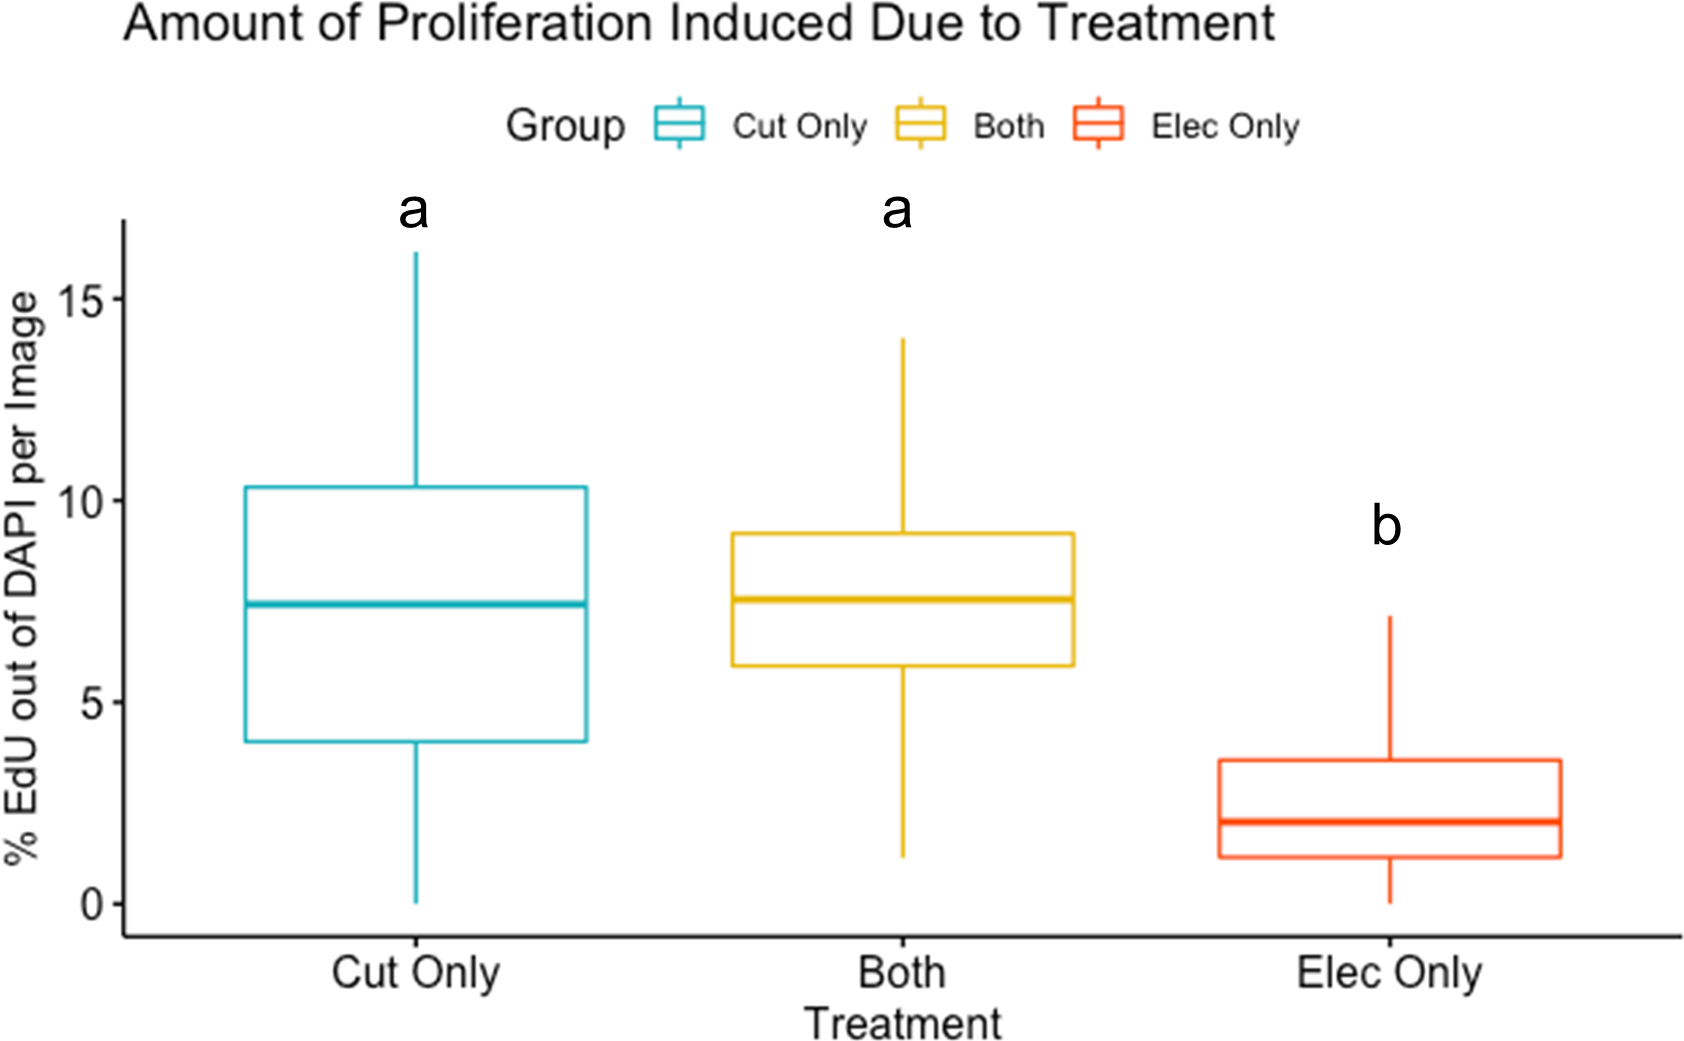
Fig. 2 Boxplot of the percentage of proliferating nuclei (EdU) out of all nuclei (DAPI), in three different treatment groups: cut only (blue), both cut and electroporation (yellow), and electroporation only (red). The boxplot displays the minimum, 25th percentile, median, 75th percentile, and maximum for the groups. p<0.001 between two statistic groups a and b by ANOVA.
Acknowledgments
This image is the copyrighted work of the attributed author or publisher, and
ZFIN has permission only to display this image to its users.
Additional permissions should be obtained from the applicable author or publisher of the image.
Full text @ PLoS One