
Fig 2
- ID
- ZDB-IMAGE-210821-36
- Publication
- Kuil et al., 2021 - Size matters: Large copy number losses in Hirschsprung disease patients reveal genes involved in enteric nervous system development
- All Figures
- Figures for Kuil et al., 2021
|
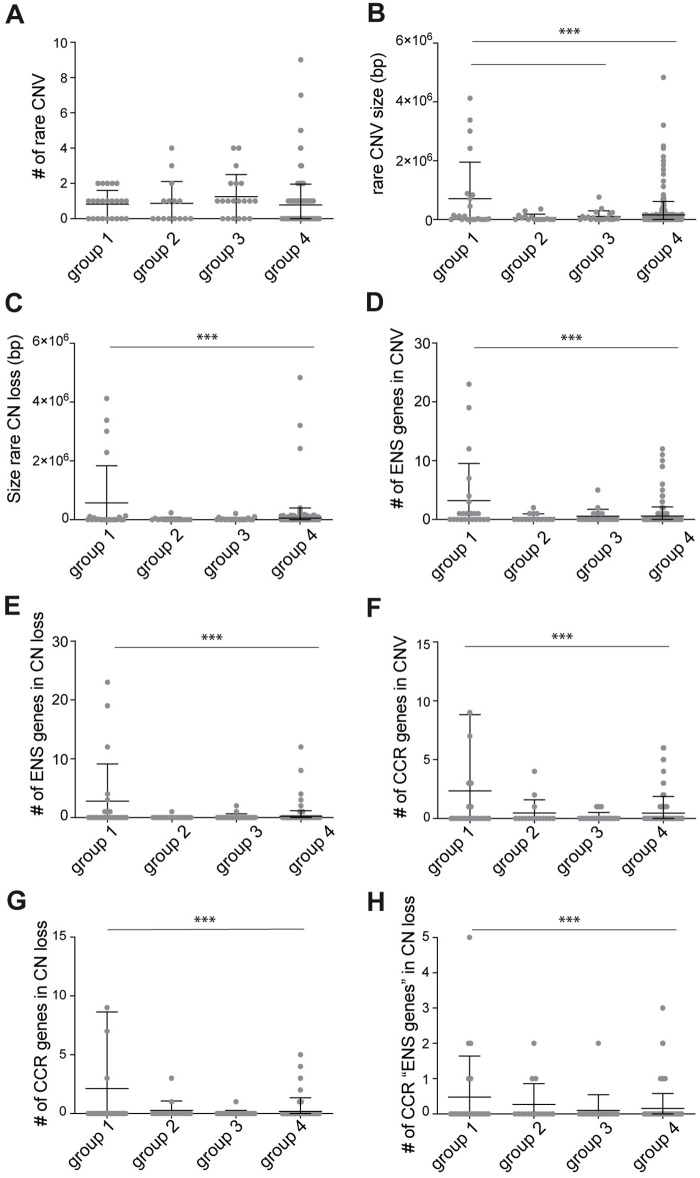
Fig 2
(A) Graph showing the number of rare CNVs found in the four groups. No statistical differences were found. (B) Graph showing the size in base pairs (bp) of the rare CNVs found in the four groups. Rare CNV size in group 1 (HSCR-AAM) was significantly larger than those found in group 3 (HSCR without a causal variant identified) and group 4 (controls). (C) Graph showing the size (bp) of the rare CN losses found in the four groups. Rare CN loss size in group 1 (HSCR-AAM) was significantly larger than those found in group 4 (controls). (D) Graph showing the number of “ENS genes” included in the CNVs found in the four groups. The number of “ENS genes” included in CNVs of group 1 (HSCR-AAM) was significantly higher than those found in group 4 (controls). (E) Graph showing the number of “ENS genes” included in the CN losses found in the four groups. The number of “ENS genes” included in CN losses of group 1 (HSCR-AAM) was significantly higher than those found in group 4 (controls). (F) Graph showing the number of CCR genes included in the CNVs found in the four groups. The number of CCR genes included in CNVs of group 1 (HSCR-AAM) was significantly higher than those found in group 4 (controls). (G) Graph showing the number of CCR genes included in the CN losses found in the four groups. The number of CCR genes included in CN losses of group 1 (HSCR-AAM) was significantly higher than those found in group 4 (controls). (H) Graph showing the number of “ENS genes” that are also a CCR, included in the CN losses found in the four groups. These genes were considered as the HSCR candidate genes. The number of CCR “ENS genes” included in CNVs of group 1 (HSCR-AAM) was significantly higher than those found in group 4 (controls). Each dot represents one patient. Error bars represent standard deviation. Statistical analysis used: one-way ANOVA followed by students t-test. ** p < 0.01 *** p < 0.001; Exact p-values and statistics can be found in