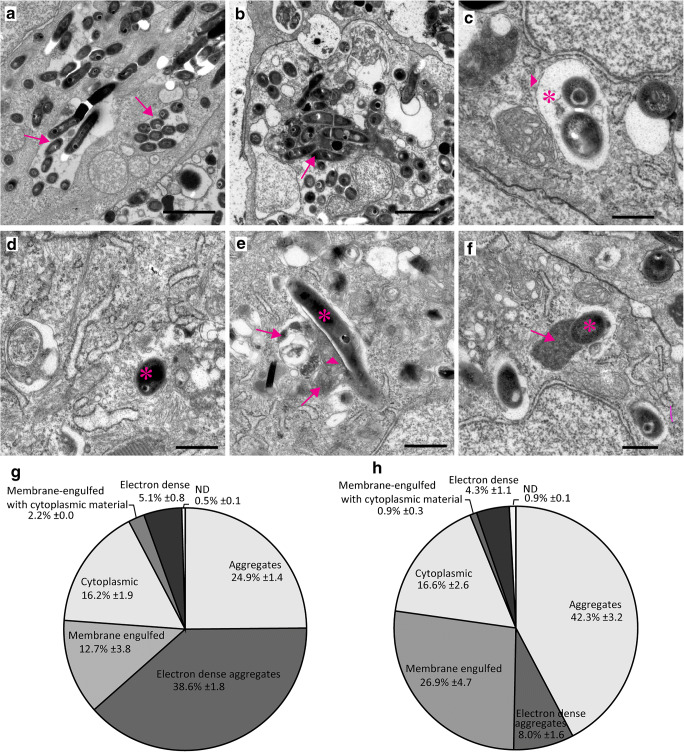
Fig. 5
Quantification of intracellular Mm shows altered distribution of bacteria in different compartments in myd88-/- larvae. a–f Representative TEM images of Mm in different compartments. a Aggregates as a compact cluster of bacteria (> 5) without any electron-dense areas (arrows). b Electron-dense aggregates as a compact cluster of bacteria in a compartment having a uniform high electron density between the bacteria (arrowhead) and/or electron-dense regions (arrow). c Membrane-engulfed compartments containing bacteria surrounded by a single membrane (arrowhead) with an electron-transparent zone (asterisk), without any cytoplasmic material. d Cytoplasmic bacteria not enclosed by a membrane, indicated by a white asterisk. e Membrane-engulfed compartments with cytoplasmic material containing bacteria (asterisk), and partially degraded content (arrowhead) and other fused vacuoles (arrows). f Electron-dense compartments containing bacteria (asterisk) with uniform electron-dense content (arrow). g,h The fractions (± SEM) of intracellular Mm found in different compartments or free in the cytoplasm is presented in a pie chart for myd88+/+ (total is 2178 bacteria) (g) and myd88-/- (total is 1655 bacteria) (h). N is 3 larvae with initial stage granulomas per group at 4dpi, with the section at middle of granuloma were imaged and analysed for each larva. The scale bars in (a)–(b) (2 μm) and in (c)–(f) (500 nm)

