
|
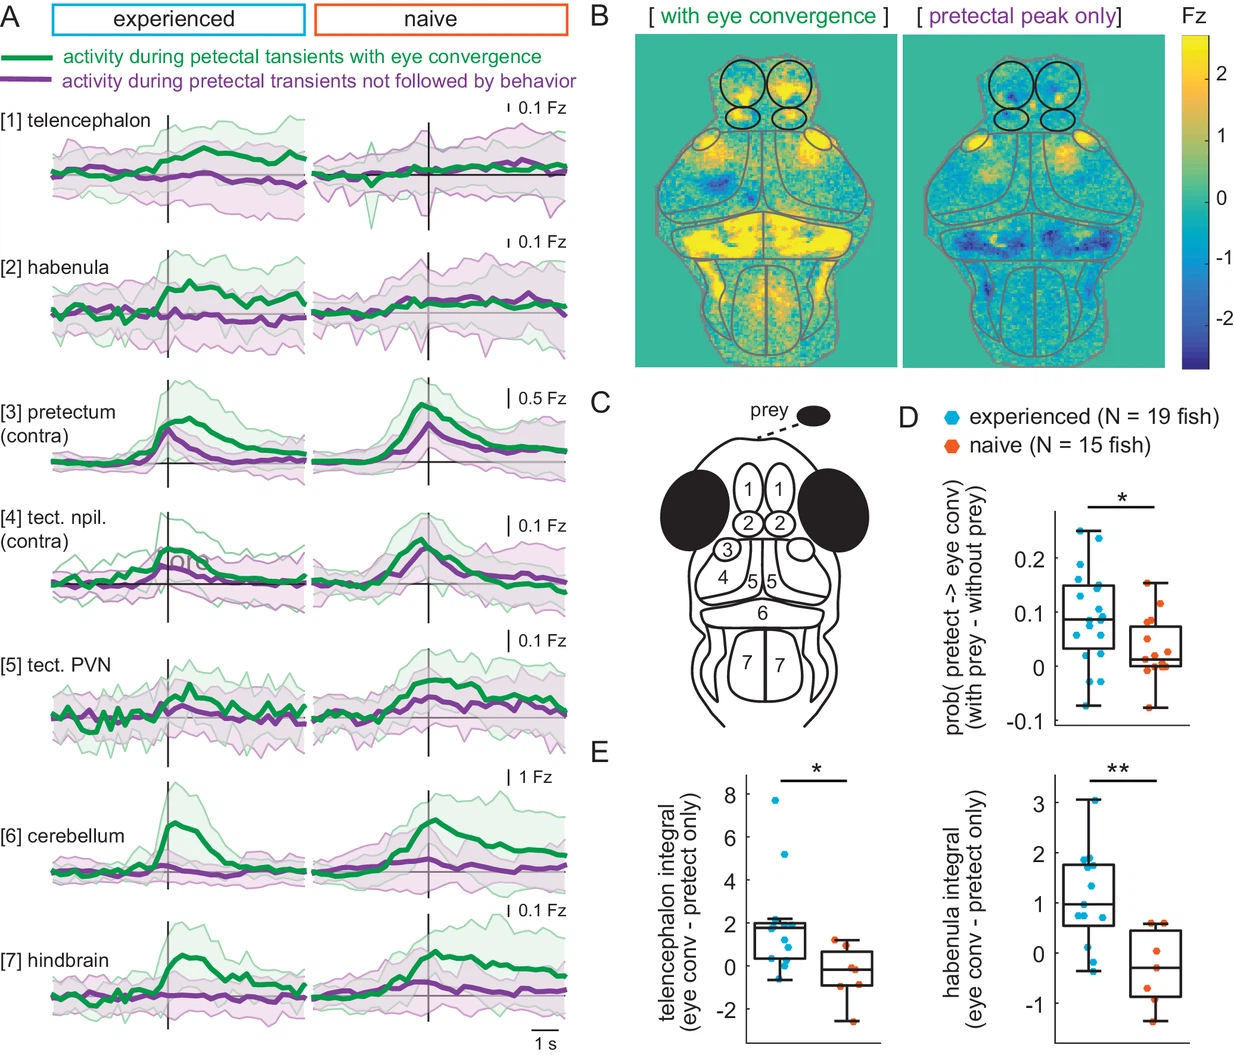
Fig. 6 (A) Time traces of activity in seven brain regions during either a pretectum transient followed by eye convergence (green) or a pretectum transient with no behavior (purple) in a representative prey-experienced fish (left, N = 12 convergences, N = 42 pretectum-only events) and prey-naïve fish (right, N = 15 convergences, N = 20 pretectum-only events). Black vertical line represents the pretectal activity peak to which transients are aligned. ‘Contra’ and ‘ipsi’ refer to the side with higher or lower pretectal transient amplitude peak time (see Materials and methods). (B) Average brain activity maps for another representative prey-experienced fish in presence of prey, showing summed calcium activity over 4.2 s (five frames before to 10 frames after event), during either pretectum transients associated with eye convergence (prey to left or right of the fish, N = 22) or pretectum transients not accompanied by behavior (N = 34). Brain areas are outlined in gray as in schematic C, and forebrain areas are additionally outlined in black. (A and B) show that forebrain areas appear active during pretectal transients associated with eye convergence, but not pretectal transients not accompanied by behavior. (C) Schematic of anatomical areas considered in A and B. (D) Prey-experienced fish (N = 19) have a higher probability of pretectum transients being associated with eye convergence than prey-naïve fish (N = 15), suggesting visual events are more likely to cause motor output with experience of live prey (* indicates p = 0.03). Raw values of evoked and spontaneous probabilities are not significantly different in experienced versus naïve fish (reported in Figure 6—source data 1). (E) Prey-experienced fish (blue) have significantly more telencephalon (left, p = 0.02) and habenula (right, p = 0.004) activity than prey-naïve fish (red) during pretectal transients associated with eye convergence relative to pretectal transients not accompanied by behavior. Box plot shows difference in fluorescence integral five frames before to five frames after events (pretectal transient with vs. without eye convergence). Fish with < 5 eye convergences were excluded, prey-experienced fish N = 13, prey-naïve fish N = 7. * and ** indicate p < 0.05 and p < 0.01 respectively. A permutation test was used for all pairwise comparisons if not specified otherwise (see Materials and methods, Behavioral data analysis and statistics). Data tables for panels A, D, E, and F are in Figure 6—source data 1.