
|
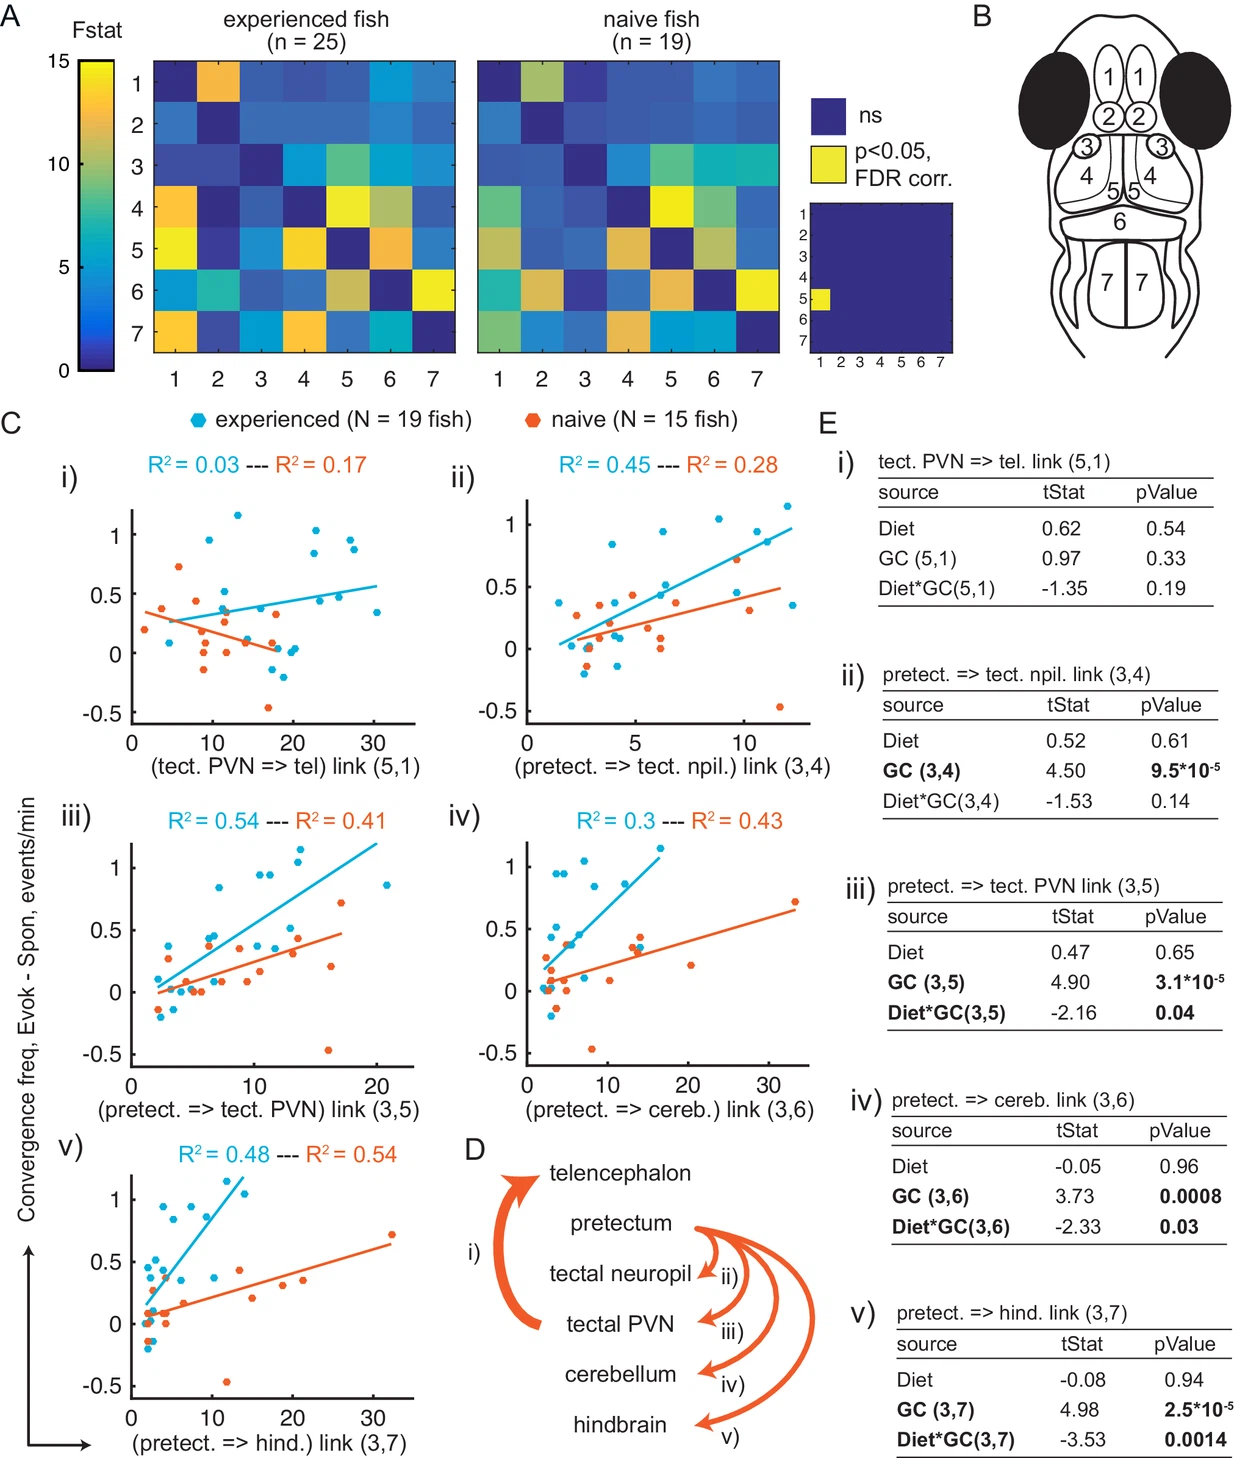
Fig. 5 (A) Average Granger-causality between brain areas in prey-experienced (left) and prey-naïve (right) fish. Activity from left and right sides averaged as depicted in anatomical schematic (B). F-statistics ranged from 0 to 34.1. Inset: Pairwise statistical comparison of all links. Significant interactions represented in yellow (p < 0.05, pairwise Ts, FDR corrected, see Materials and methods, Behavioral data analysis and statistics; see Supplementary file 3 for p-values). (B) Brain areas shown in schematic are: 1: telencephalon, 2: habenula, 3: pretectum, 4: tectal neuropil, 5: tectal PVNs, 6: cerebellum, 7: hindbrain. (C–E) Granger-causality statistic is significantly correlated (p-values in E, ‘GC’ row in each table) with eye convergence frequency for interactions from pretectum to downstream areas (interactions shown to be significantly stronger in ‘strong’ hunters, see Figure 5—figure supplement 1), but not for interaction from tectal PVNs to telencephalon (interaction shown to be significantly stronger in prey-experienced fish in A). Interaction between experience of prey (‘Diet’) and Granger-causality strength was significant for pretectum to tectal PVN, pretectum to cerebellum, and pretectum to hindbrain (p-values in E, ‘Diet*GC’ row in each table). (C) Eye convergence frequency (evoked – spontaneous) as a function of Granger-causality strength for: (i) tectal neuropil→telencephalon (5,1), (ii) pretectum→tectal neuropil (3,4), (iii) pretectum→tectal PVN (3,5), (iv) pretectum→cerebellum (3,6), (v) pretectum→hindbrain (3,7). Statistics of linear regression model are in (E). (D) Schematic of links considered in (C). (E) Robust linear regression model: [Convergence Frequency ~1 + Diet + GC + Diet*GC], where ‘Convergence Frequency’ is (with prey – without prey), ‘GC’ is Granger-causality Fstat, ‘Diet’ is prey-experienced or prey-naïve fish (categorical variable), and ‘Diet*GC’ is interaction between experience of prey and Granger-causality statistic. N = 19 and N = 15 prey-experienced and prey-naïve fish respectively. Significant terms are bolded, GC for all links but link (5,1), and (GC*diet) interactions for links (3,5 , 3,6) and (3,7). Data table for panel A and C in Figure 5—source data 1.