
|
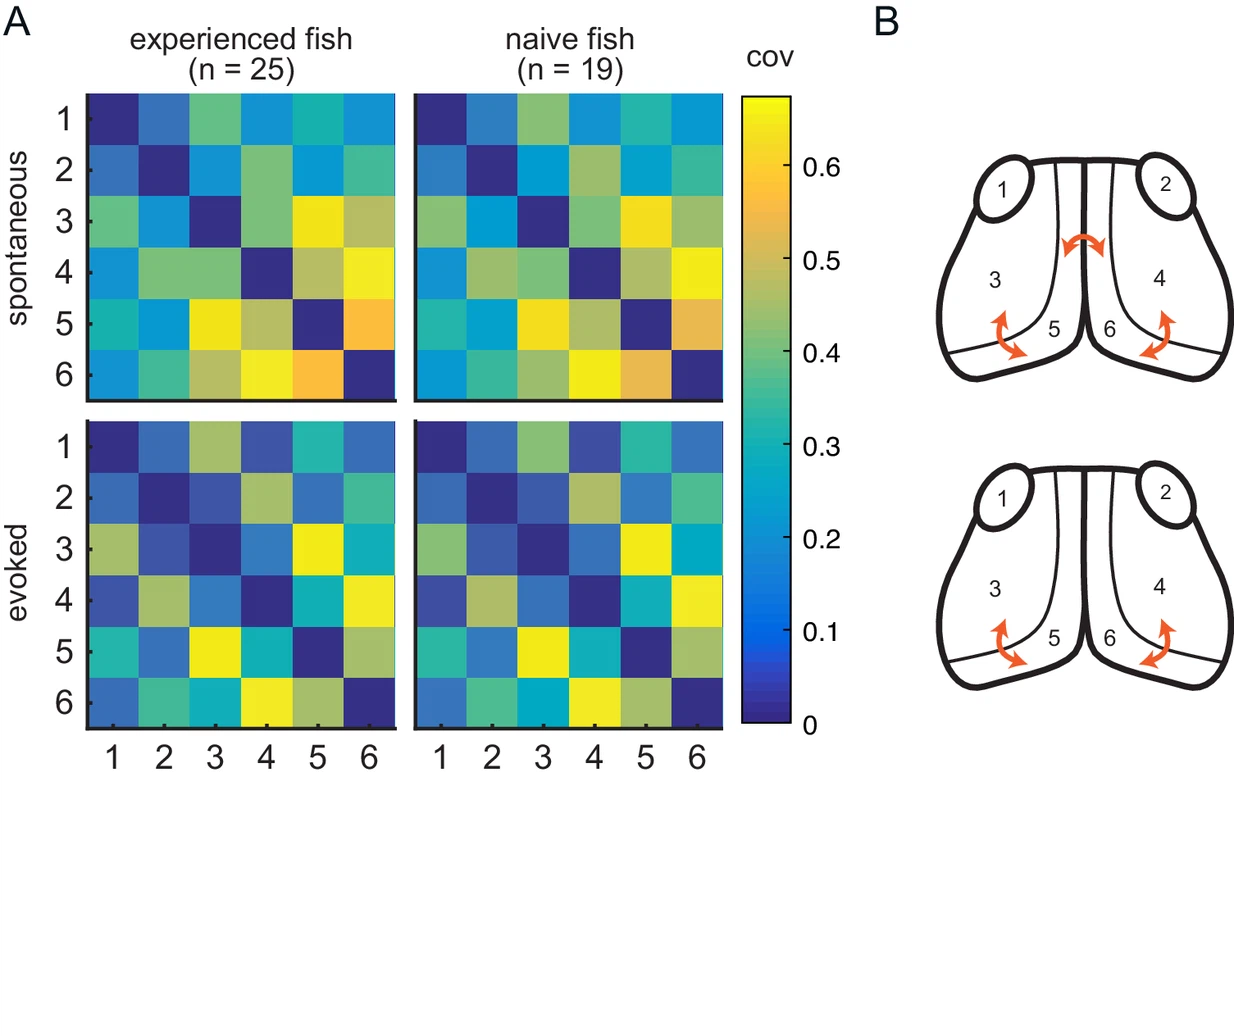
Fig. 4.1 (A) Pairwise covariance (a non-directed measure of interaction) was calculated between the visual areas in spontaneous (top row) and evoked (bottom row) conditions and prey-experienced (left column) and prey-naïve (right column) fish. There were no statistical differences between prey-experienced and prey-naïve fish in the spontaneous or the evoked conditions (pairwise Ts, FDR corrected). (B) Links with linear correlation values higher than 0.5 for spontaneous (top) and evoked (bottom) conditions are represented by the orange arrows. Data table for panel A in Figure 4—figure supplement 1—source data 1.