
Image
|
Figure Caption
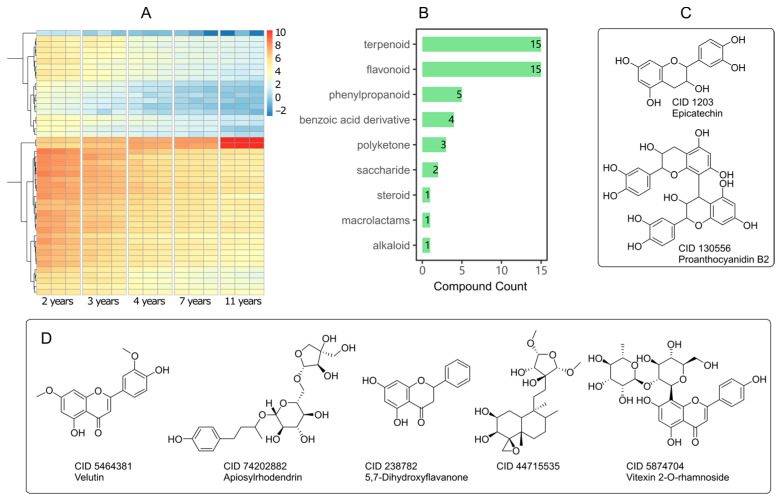
Figure 4 Main components in leaves affected by tree ages. (A) Hot spot map of increasing and decreasing components depending on tree age. The color palette represents the content of metabolites. (B) Components counts in different structural types. (C) Compounds up-regulated annually (FC > 32, p < 0.01). (D) Representative compounds down-regulated annually (FC > 32, p < 0.01). See Table S1 for details.
Acknowledgments
This image is the copyrighted work of the attributed author or publisher, and
ZFIN has permission only to display this image to its users.
Additional permissions should be obtained from the applicable author or publisher of the image.
Full text @ Pharmaceuticals (Basel)