
|
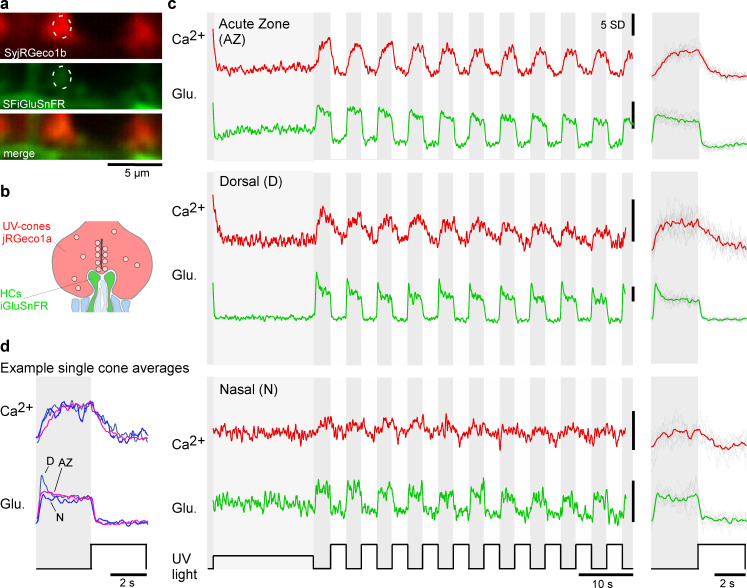
Figure 2 (a, b) Simultaneously acquired two-photon scans of cone terminals and opposing horizontal cell dendrites, with cone pedicles expressing SyjRGeco1b (red), and horizontal cell dendrites expressing SFiGluSnFR (green), and schematic representation, showing the cone pedicle (red) with ribbon and vesicles, as well as horizontal cell processes (green) and bipolar cell dendrites (blue). (c) Examples of raw calcium (red) and glutamate (green) traces recorded simultaneously from single UV-cones, one from each eye region as indicated. The averaged traces and superimposed stimulus repetitions are shown on the right. (d) Overlay of the averaged traces in (c), highlighting different glutamate responses despite very similar calcium responses.