
IMAGE
Figure 1—figure supplement 1.
- ID
- ZDB-IMAGE-210802-38
- Source
- Figures for Schroeder et al., 2021
Image
|
Figure Caption
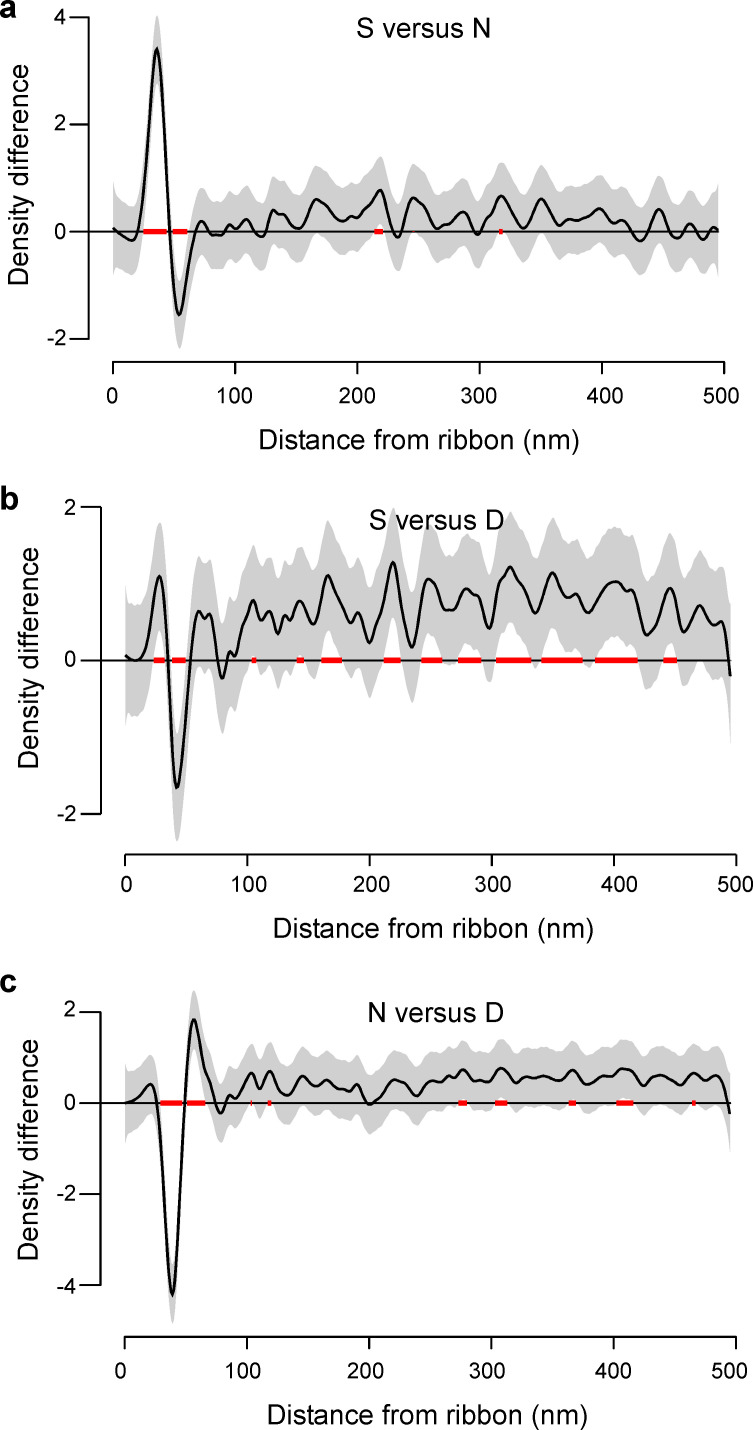
Figure 1—figure supplement 1. (a-c) Pairwise comparison of the three regions, modelled as generalised additive model (Materials and methods). The estimated mean difference (black) and 95% confidence intervals (grey) are shown and distances with significant differences (α = 0.05) are highlighted (red).
Acknowledgments
This image is the copyrighted work of the attributed author or publisher, and
ZFIN has permission only to display this image to its users.
Additional permissions should be obtained from the applicable author or publisher of the image.
Full text @ Elife