
IMAGE
Figure 2—figure supplement 1.
- ID
- ZDB-IMAGE-210802-22
- Source
- Figures for Schroeder et al., 2021
Image
|
Figure Caption
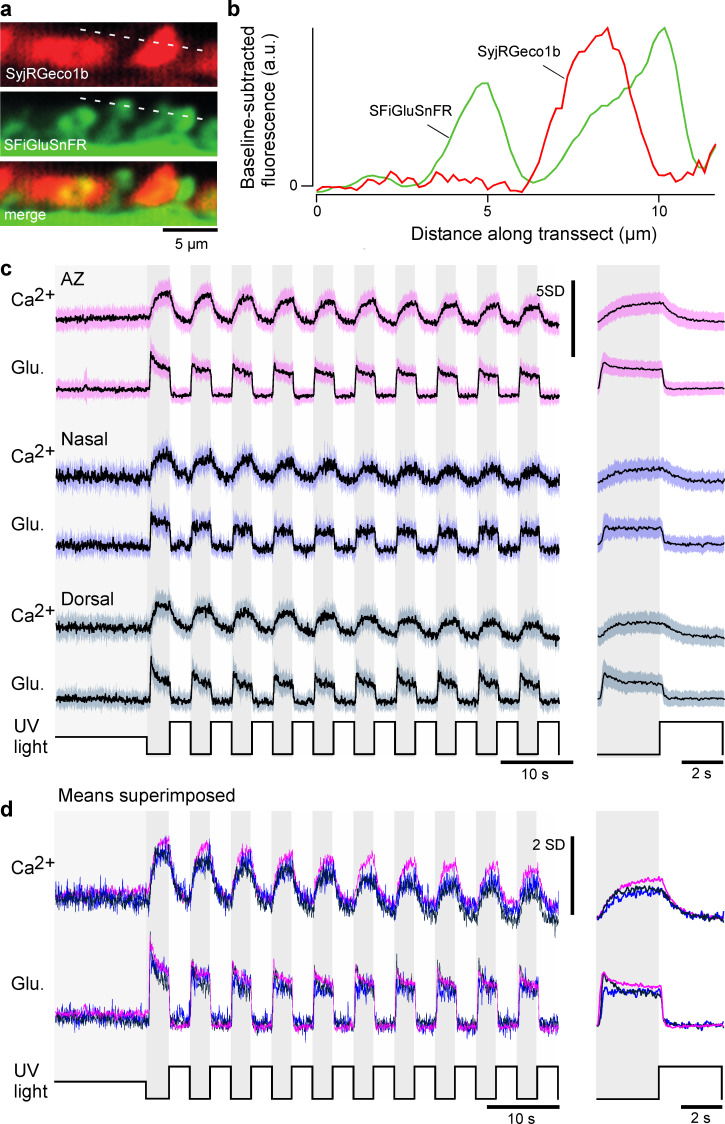
Figure 2—figure supplement 1. (a) As Figure 2a, example ‘red’ (top) and ‘green’ (middle) fluorescence channels acquired simultaneously, and merged (bottom) and (b) extracted fluorescence profiles in the two channels as indicated. Note the absence of any obvious ‘bleed-through’, indicating good spectral separation of the two fluorescence detection bands. (c) Z-scored recordings before scaling and denoising (mean ± SD). (d) Superimposed means of the data shown in (c).
Acknowledgments
This image is the copyrighted work of the attributed author or publisher, and
ZFIN has permission only to display this image to its users.
Additional permissions should be obtained from the applicable author or publisher of the image.
Full text @ Elife