
|
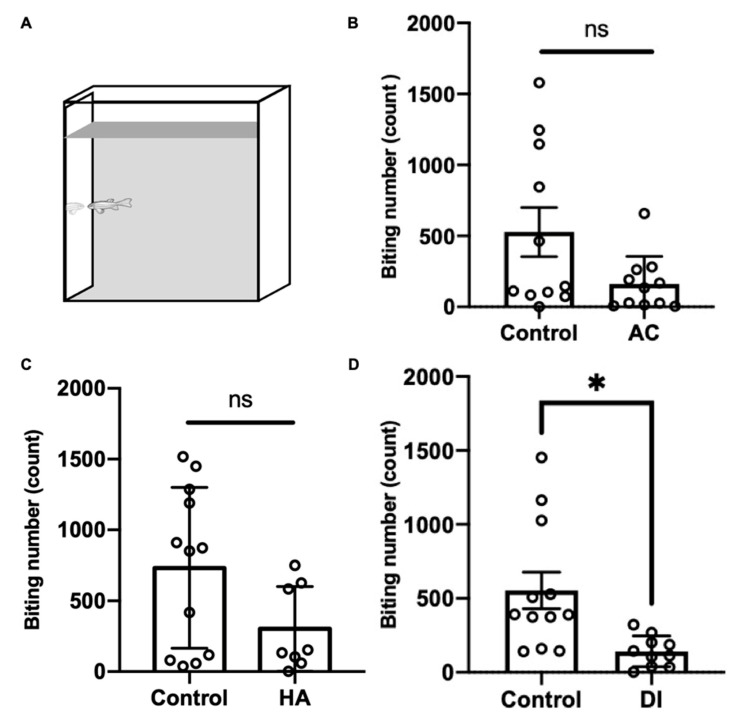
Figure 7 Effects of AC, HA, and DI treatments in the mirror biting test. (A) Schematic of the mirror biting test. Adult zebrafish were exposed (B) AC, (C) HA, or (D) DI, and the mirror-biting frequency was determined. Each circle represents the data of one single fish. In AC treatment, n = 11 for control group; n = 10 for the treatment group. In HA treatment, n = 12 for control group; n = 8 for the treatment group. In DI treatment, n = 11 for control group; n = 10 for the treatment group. All the treatments reduced mirror-biting frequency relative to control fish. The asterisks (*) indicate significant differences between the control and treatment groups.; ns indicates that no significant difference was found between the control and treatment groups. Values are means ± SD in (A) and (C) (p < 0.05 (Student’s t-test)). Values are means ± SEM in (B) (p < 0.05 (Mann–Whitney)).