IMAGE

FIGURE 5

ID
ZDB-IMAGE-210725-12
Source
Figures for Shanaka et al., 2021
Image
Figure Caption

FIGURE 5

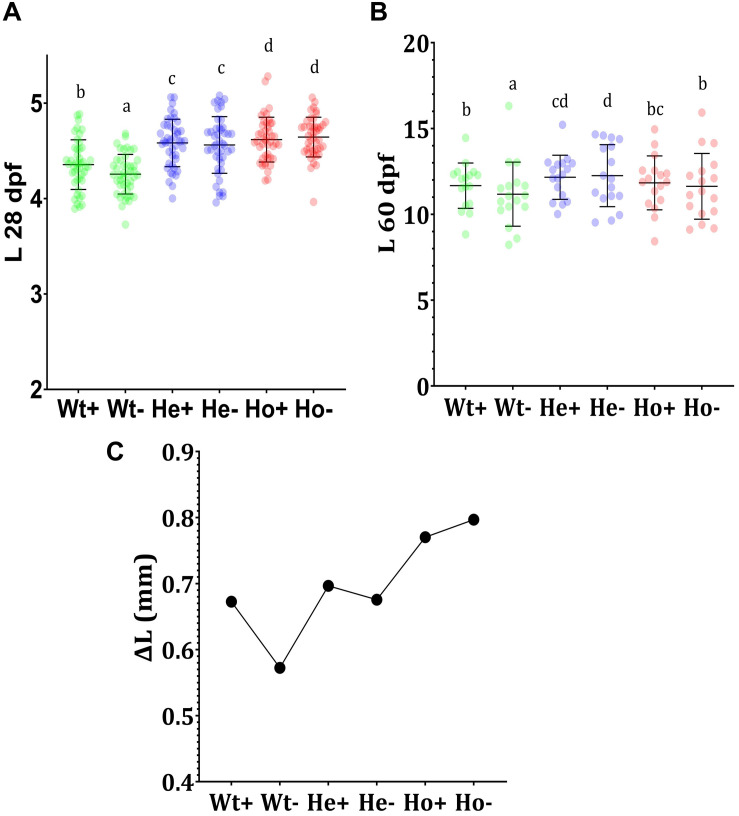
Feeding experiment and evaluation of growth Tg (b-actin:sGULO:mCherry) fish. (A) The length (mm) of Wt and Tg fish after the first 20 days of feeding (8–28 dpf), (B) The growth of the latter 30 days of feeding (30–60 dpf), and (C) the growth difference (ΔL) during the first 20 days of feeding. Every single point overlayed on the charts indicates an individual fish. Error bars represent the standard deviation of the individual body lengths. Data were analyzed with ANOVA using Duncan’s test (p < 0.5), and different lowercase letters indicate different significant levels between samples. Plus (+) and minus (-) labels indicate AA plus and absent meals, respectively.

Acknowledgments
This image is the copyrighted work of the attributed author or publisher, and ZFIN has permission only to display this image to its users. Additional permissions should be obtained from the applicable author or publisher of the image. Full text @ Front. Physiol.