
|
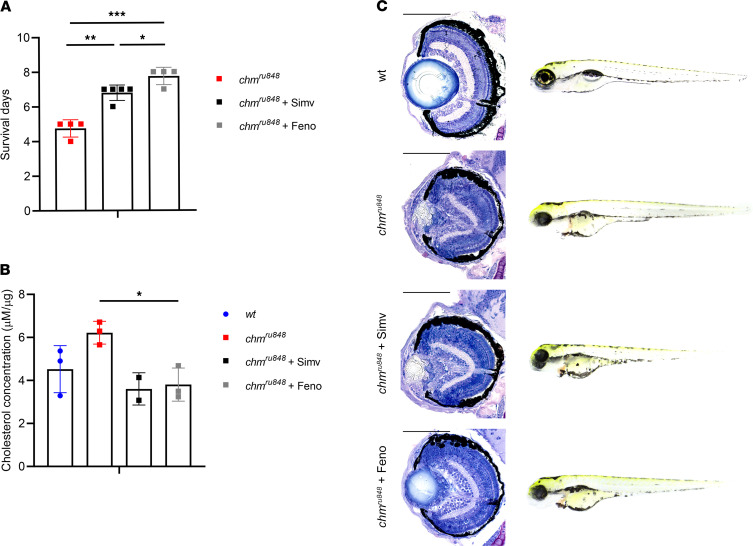
Figure 7 Characterization of chmru848 zebrafish treated daily with 0.3 nM simvastatin or 700 nM fenofibrate from 24 hours after fertilization. (A) Survival days of chmru848 fish untreated (red) or treated with simvastatin (black) or fenofibrate (gray) (n = 4, 50 fish per group). (B) Average levels of cholesterol (μM per μg of protein) in WT fish (blue circles), and chmru848 zebrafish untreated (red squares) or treated with simvastatin (black squares) or with fenofibrate (gray squares) at 6 dpf (n ≥ 2, 5 fish per condition). Data represent mean ± SD. (C) Retinal sections and wholemount morphology of WT, untreated chmru848 fish, and chmru848 fish treated with simvastatin or fenofibrate at 6dpf. Scale bar: 100 μm. P value was determined using 1-way ANOVA. *P ≤ 0.05, **P ≤ 0.01, ***P ≤ 0.001.