
|
Figure 6
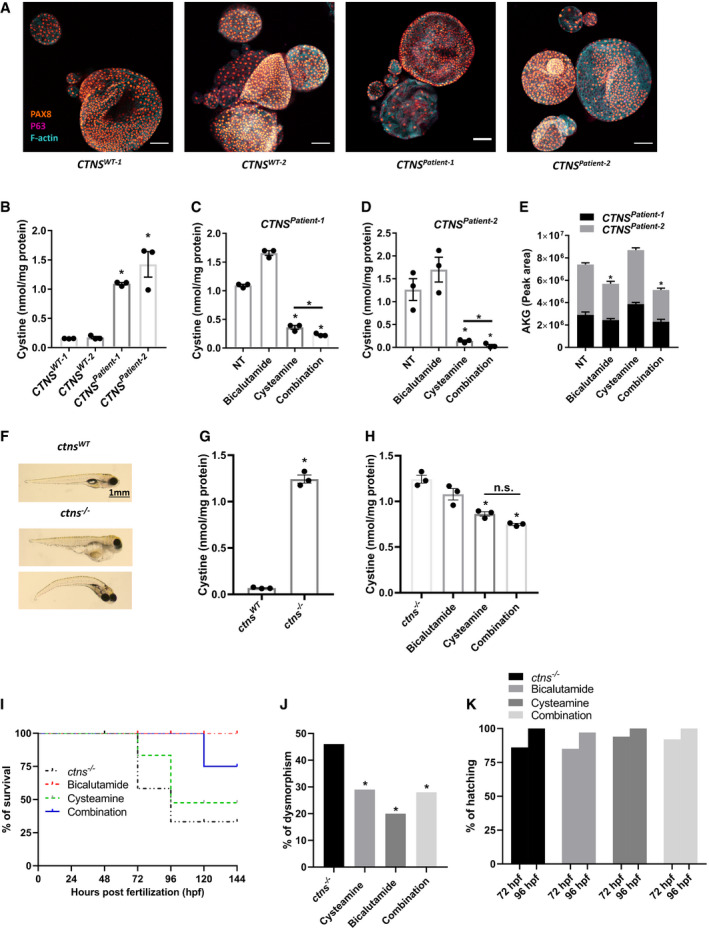
Immunocytochemistry of patient‐derived cystinotic tubuloids ( Quantification of cystine levels (nmol/mg protein) by HPLC‐MS/MS in control and cystinotic tubuloids ( Quantification of cystine levels (nmol/mg protein) by HPLC‐MS/MS in two different patient‐derived cystinotic tubuloids in the absence of the drugs (NT) or upon treatment with cysteamine (100 μM), bicalutamide (35 μM) or cysteamine (100 μM)‐bicalutamide (35 μM) combination treatment ( αKG levels measured in patient‐derived cystinotic tubuloids ( Representative images of control and cystinotic zebrafish. Quantification of cystine levels (nmol/mg protein) by HPLC‐MS/MS in control and cystinotic zebrafish ( Quantification of cystine levels (nmol/mg protein) by HPLC‐MS/MS in cystinotic zebrafish after treatment with cysteamine (1,000 µM), bicalutamide (10 µM), and a combination of cysteamine and bicalutamide (1,000 and 10 µM, respectively) ( Survival rates in Deformity rates in Hatching rates in surviving
Data information: Data are expressed as mean ± SEM. *