
Image
|
Figure Caption
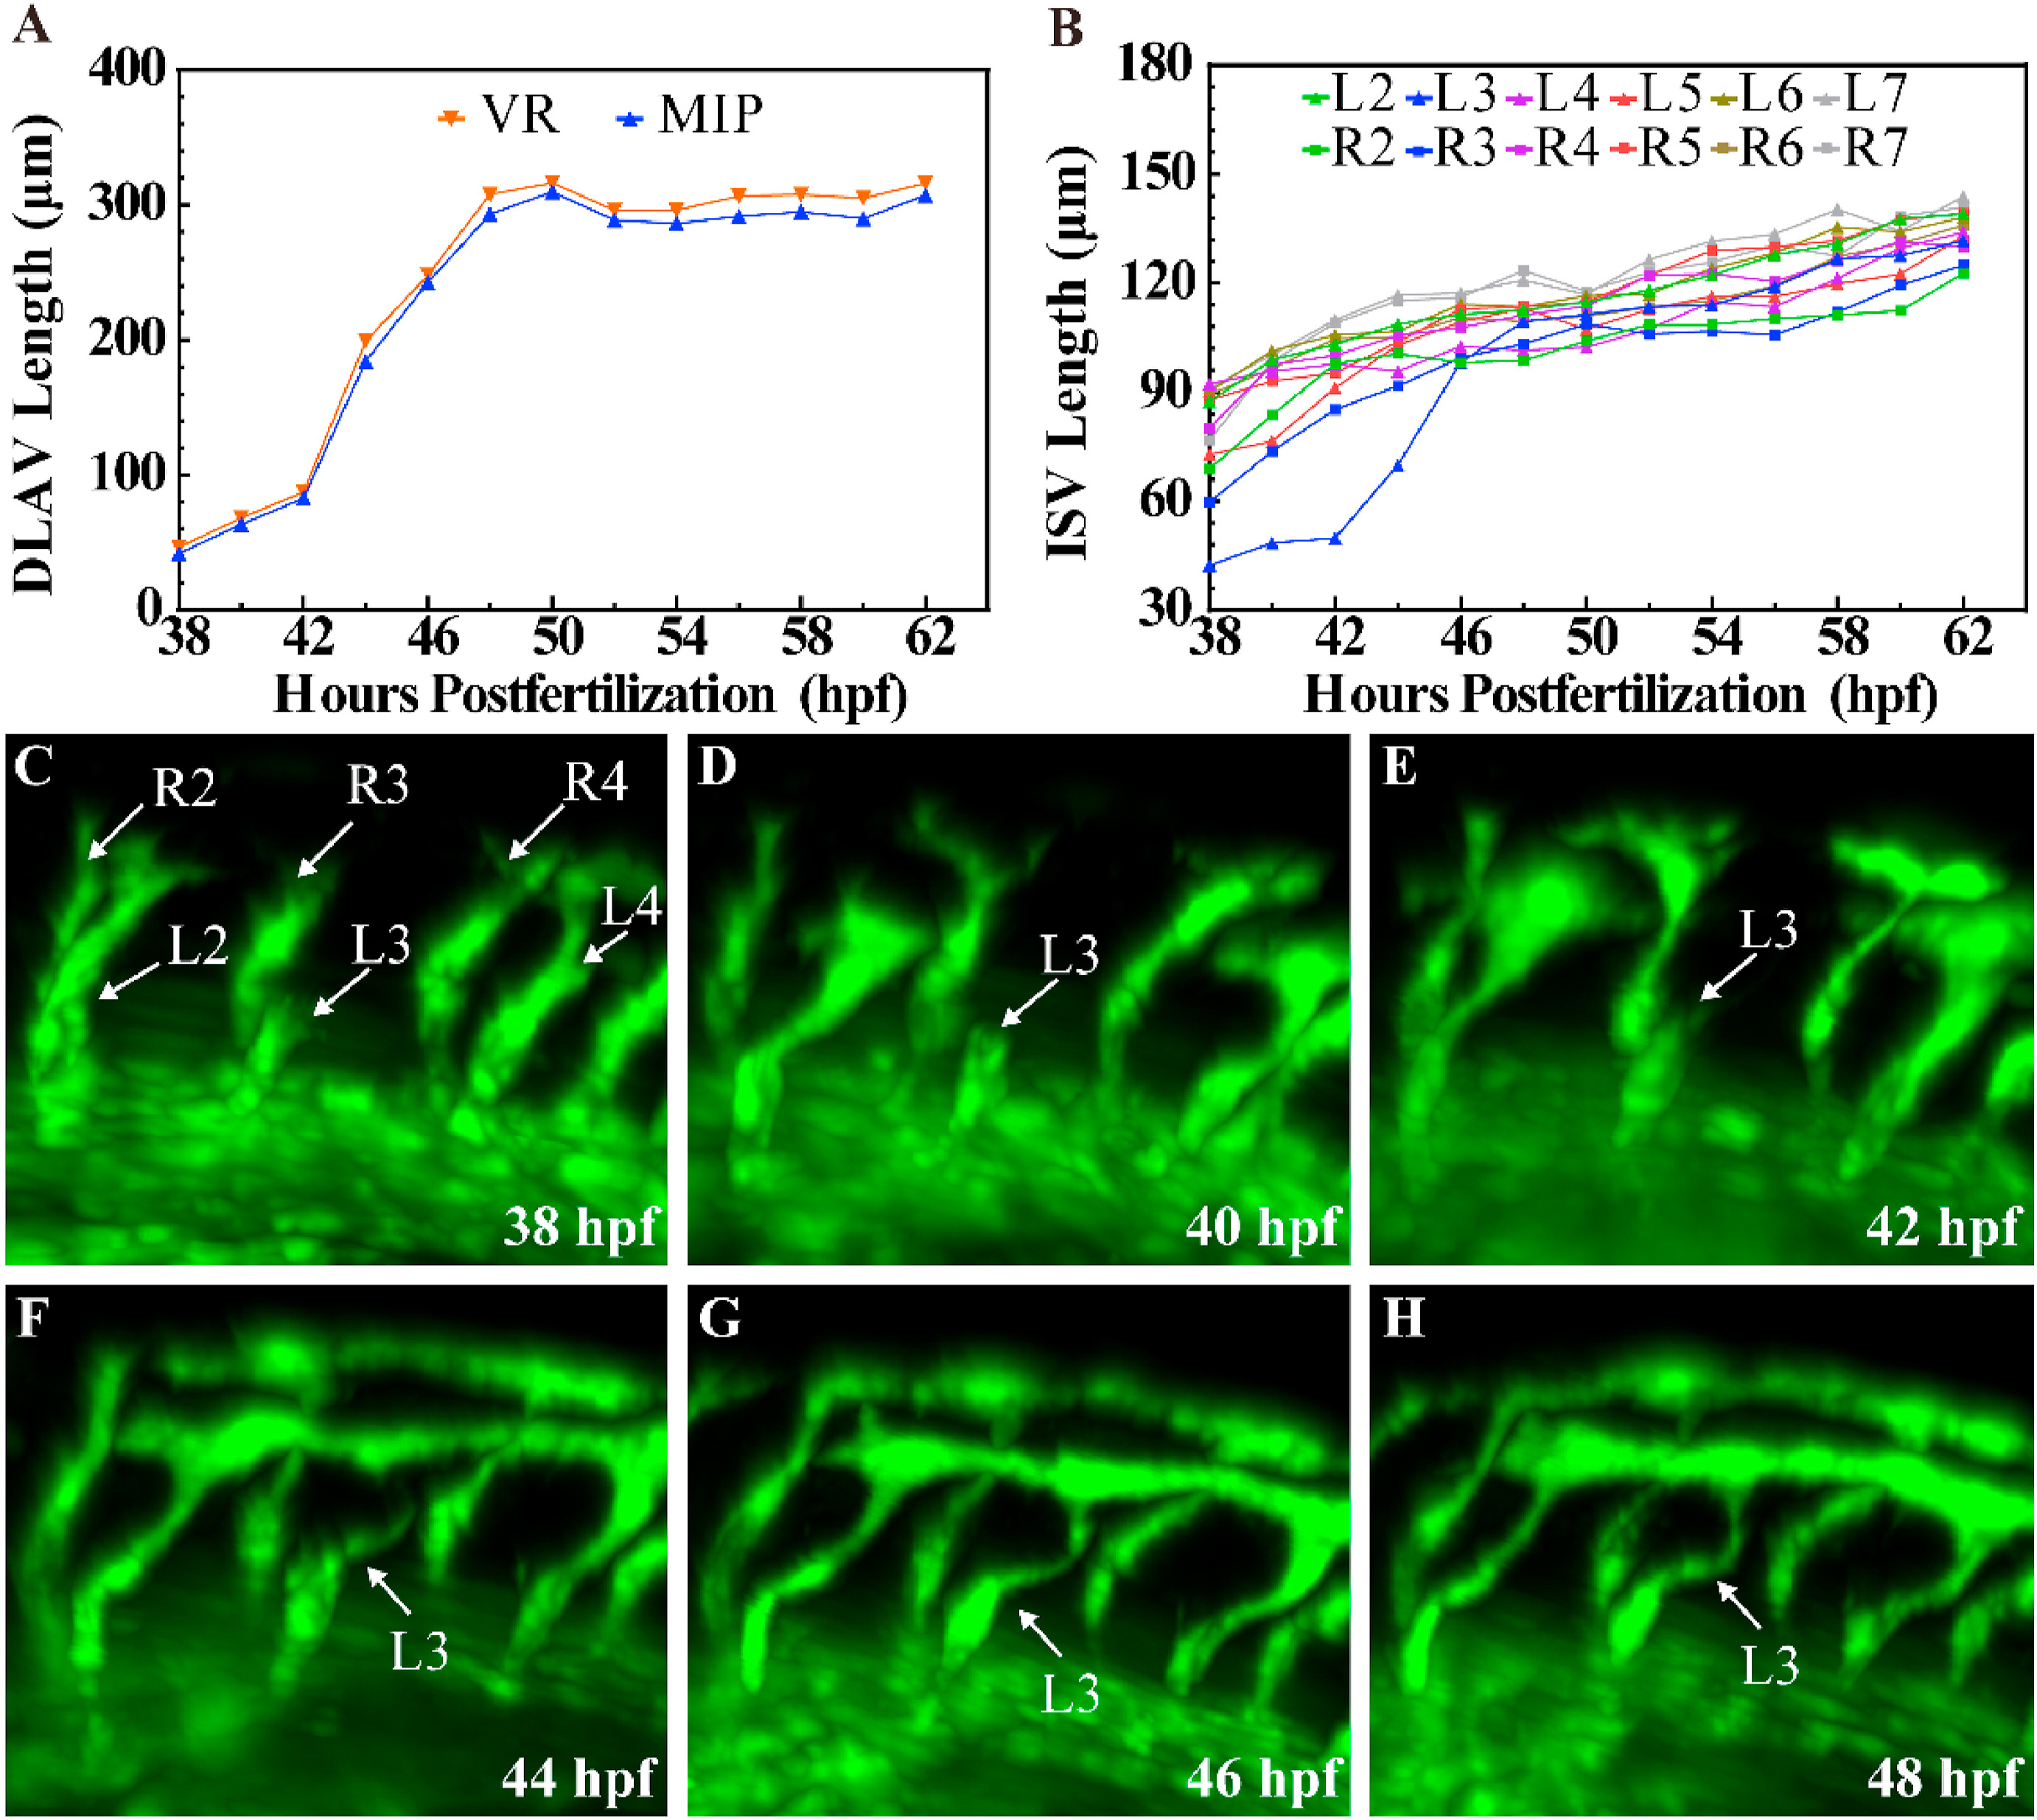
Fig. 4 The growth curve of the left DLAV and ISVs in a developing Zebrafish embryo at 38–62 hpf. (A) The growth curve of the left DLAV respectively based on MIP and VR. (B) The growth curve of 2nd to 7th pairs of ISVs based on VR. (C–H) The 3D images of 2nd to 4th pair of ISVs from 38 hpf to 48 hpf.
Acknowledgments
This image is the copyrighted work of the attributed author or publisher, and
ZFIN has permission only to display this image to its users.
Additional permissions should be obtained from the applicable author or publisher of the image.
Full text @ Biochem. Biophys. Res. Commun.