
IMAGE
Figure 3.
- ID
- ZDB-IMAGE-210708-75
- Publication
- Pollock et al., 2021 - Transcriptomic analysis of zebrafish prion protein mutants supports conserved cross-species function of the cellular prion protein
- All Figures
- Figures for Pollock et al., 2021
Image
|
Figure Caption
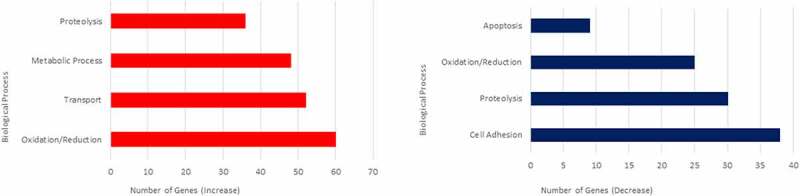
Figure 3.
Biological Process Gene Ontologies most affected in 3dpf prion mutant (
Acknowledgments
This image is the copyrighted work of the attributed author or publisher, and
ZFIN has permission only to display this image to its users.
Additional permissions should be obtained from the applicable author or publisher of the image.
Full text @ Prion