
|
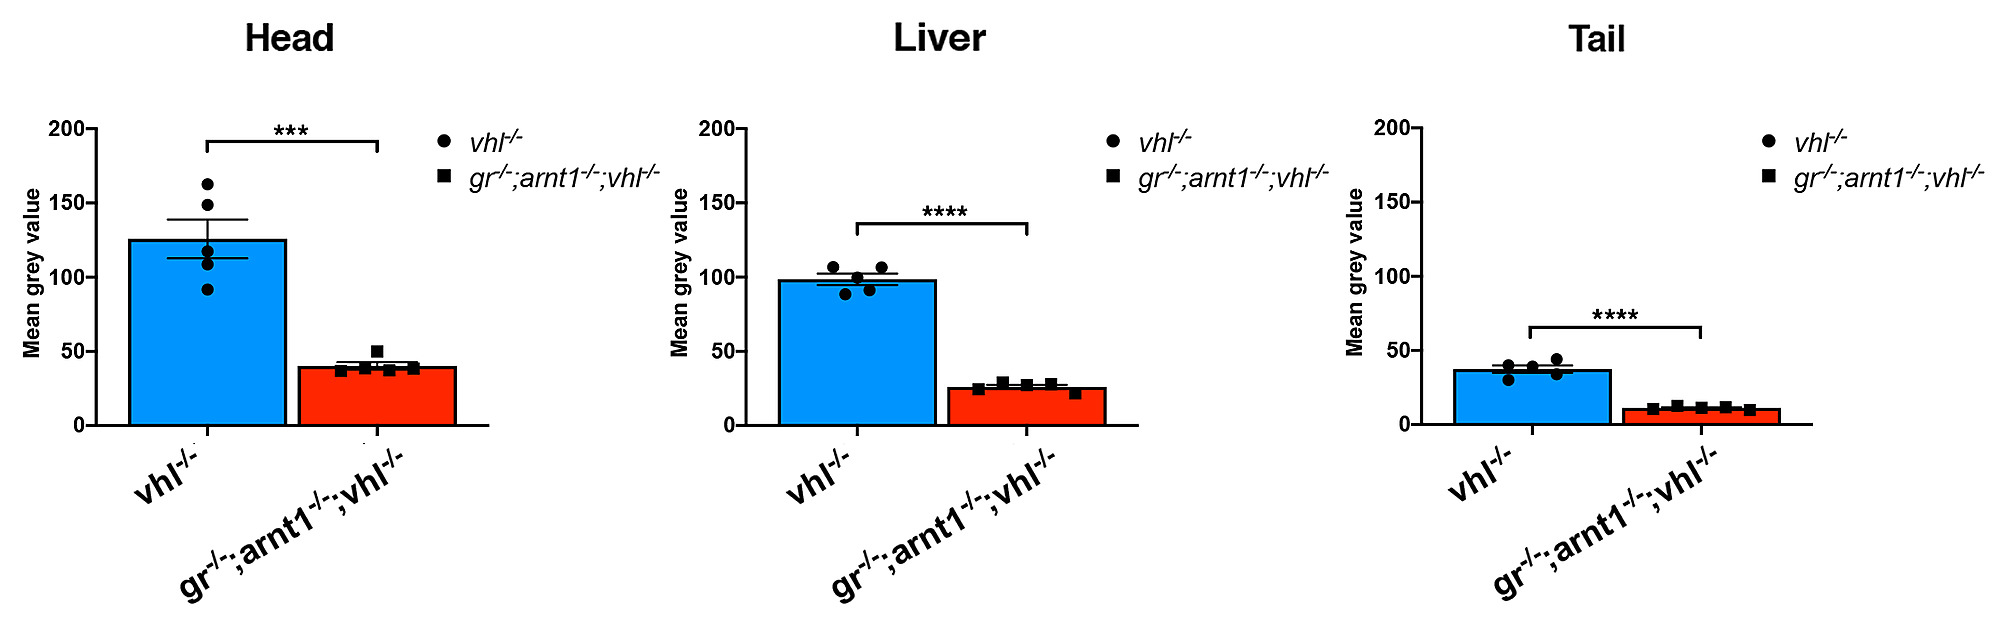
Fig. s5 gr-/-;arnt1-/-;vhl-/- showed an even more reduced phd3:eGFP brightness. Statistical analysis performed on mean gray values quantification (at the level of the head, liver and tail), after phenotypic analysis on 5dpf gr+/-;arnt1+/-vhl+/-(phd3:eGFP) incross-derived GFP+ larvae (n = 488). vhl-/- n = 5 larvae: head 125.82 ± 13.05 (mean ± s.e.m); liver 98.52 ± 3.8 (mean ± s.e.m); tail 37.43 ± 2.45 (mean ± s.e.m). gr-/-;arnt1-/-;vhl-/- n = 5 larvae: head 40.24 ± 2.46 (mean ± s.e.m); liver 26.07 ± 1.31 (mean ± s.e.m); tail 11.22 ± 0.47 (mean ± s.e.m); unpaired t-test (***P = 0.0002; ****P < 0.0001).