
Image
|
Figure Caption
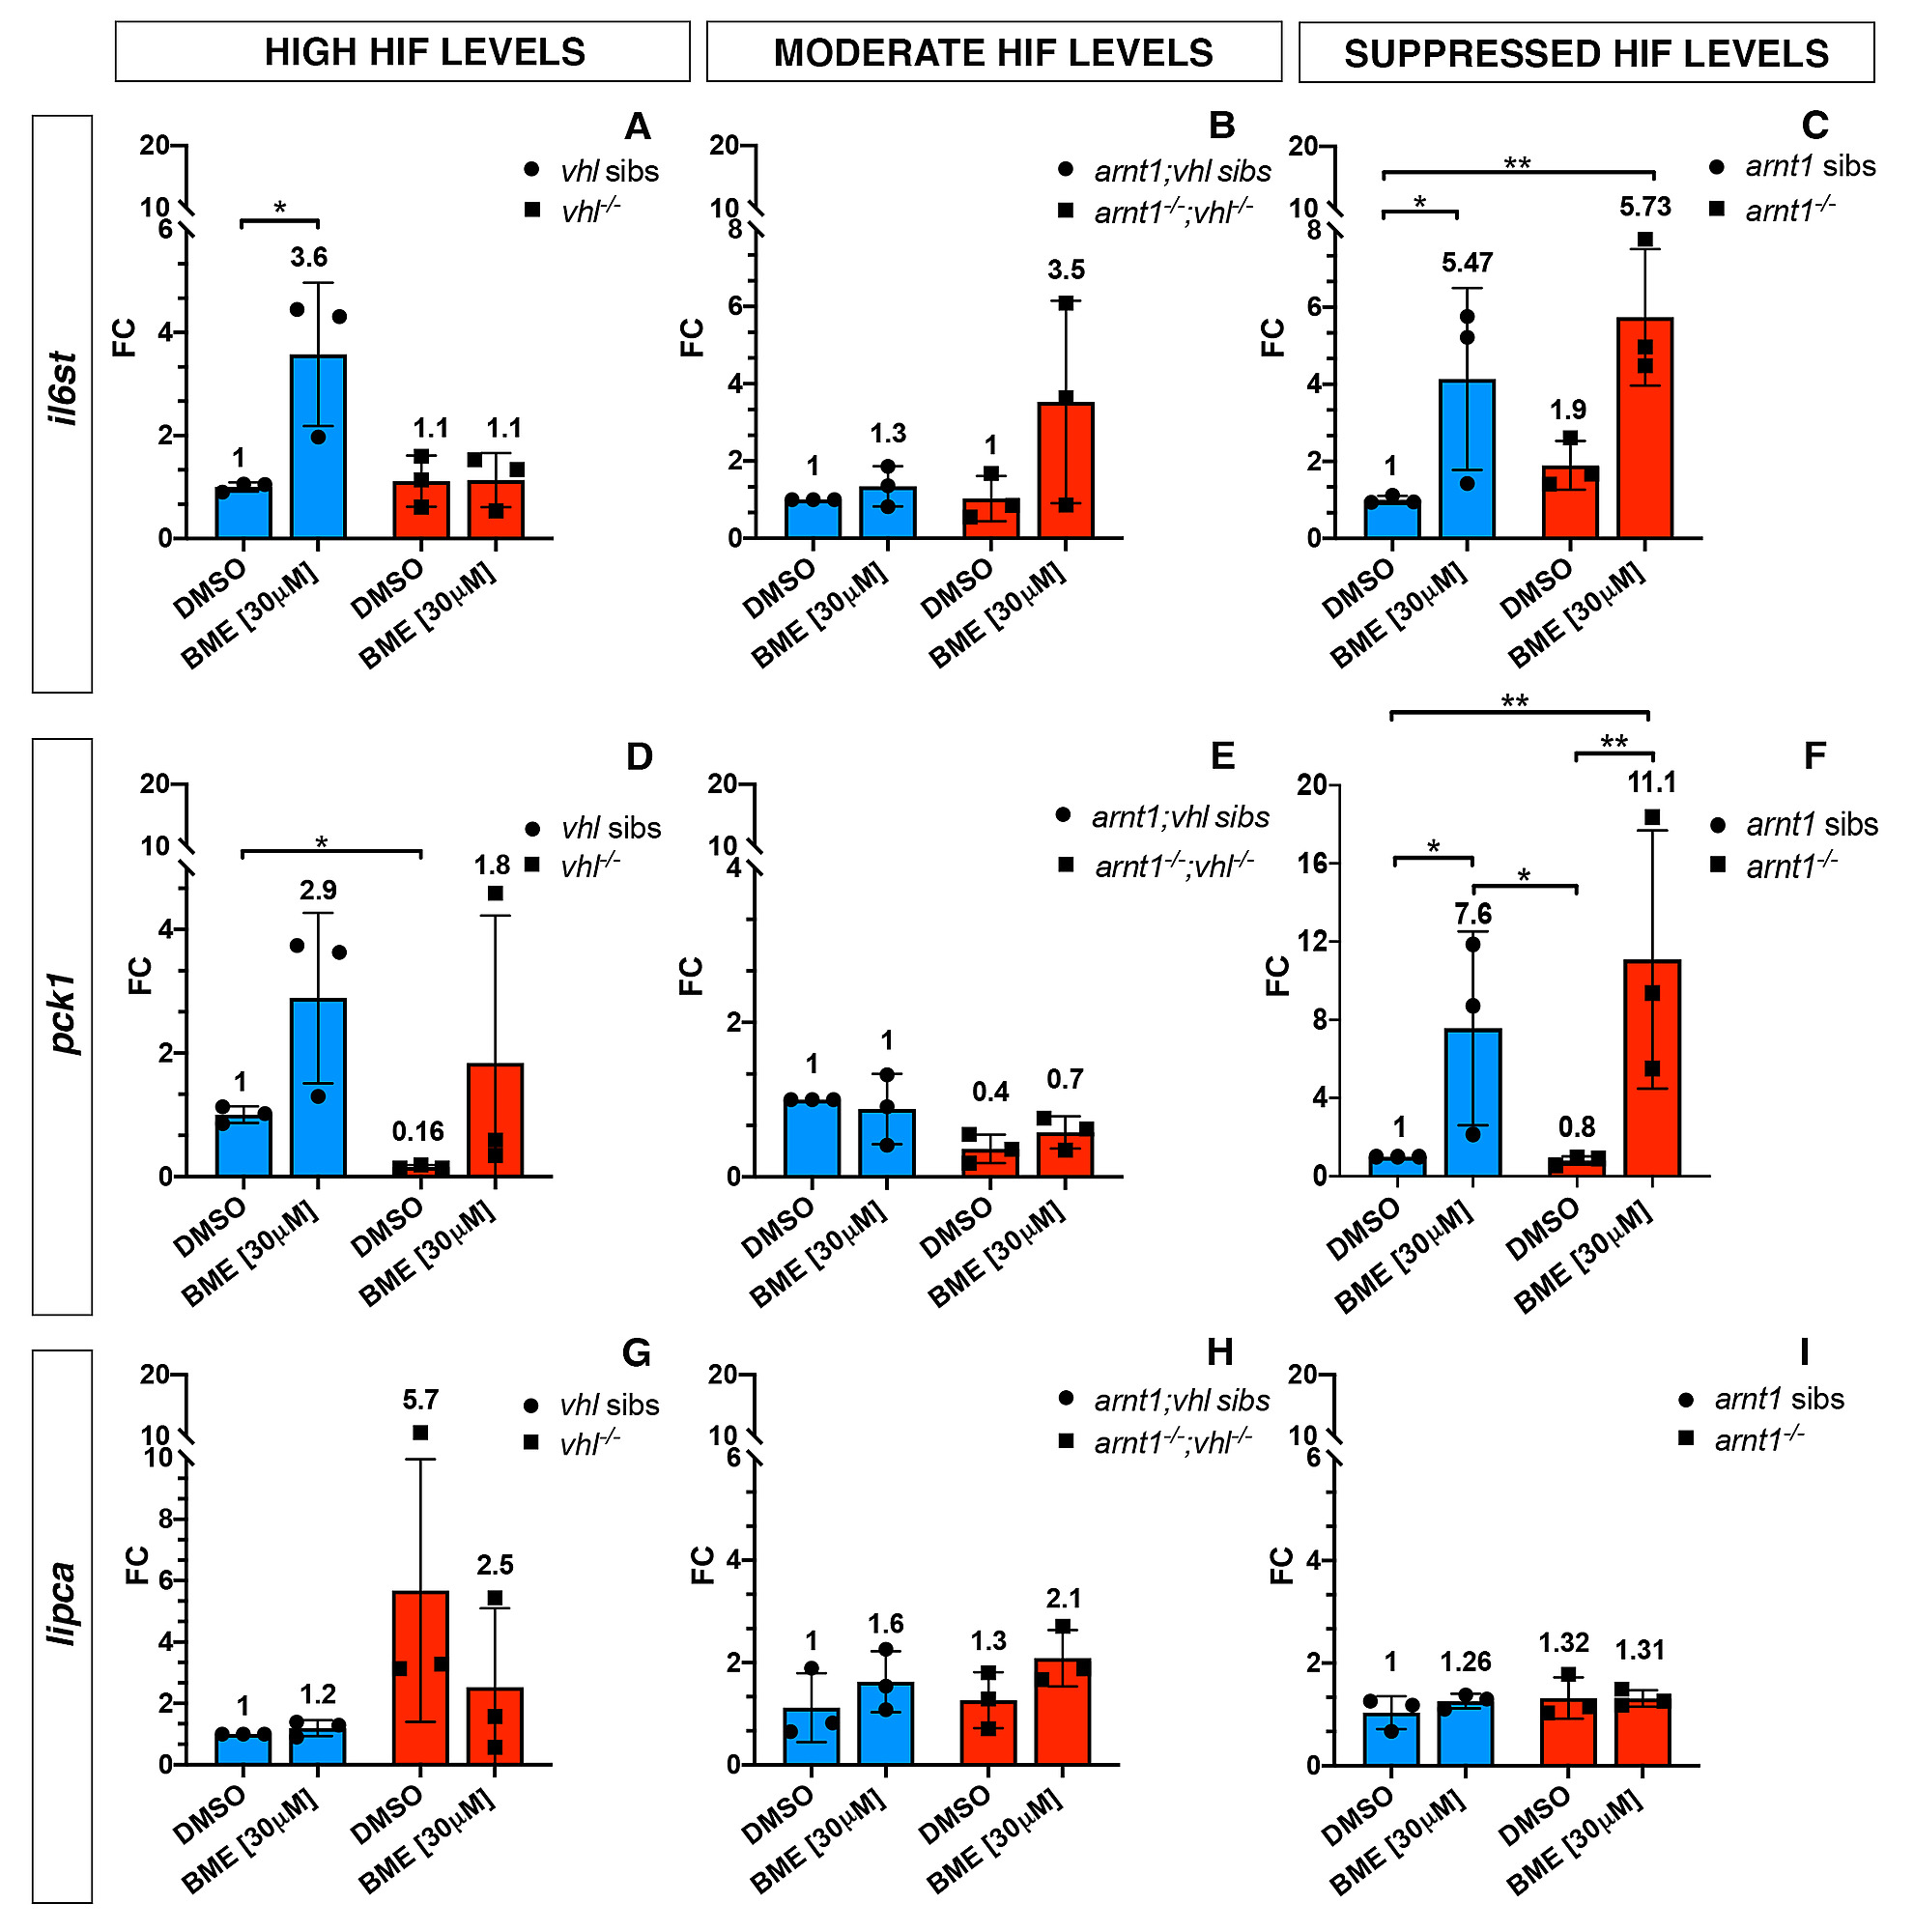
Fig. s2 GC target genes expression in the presence of high, moderately upregulated and suppressed HIF signalling pathway. Schematic view of RTqPCR analysis on il6st, pck1 and lipca (GC target genes) expression performed on the following mutant lines: vhl+/-(phd3:eGFP), arnt1+/-;vhl+/-(phd3:eGFP) and arnt1+/-(phd3:eGFP). Statistical analysis performed on ΔΔCt values; data are shown as fold change values for RTqPCR analysed samples; ordinary Two-way ANOVA followed by Dunnett’s multiple comparison test (*P < 0.05; **P < 0.01; ***P <0.001; ****P < 0.0001).
Acknowledgments
This image is the copyrighted work of the attributed author or publisher, and
ZFIN has permission only to display this image to its users.
Additional permissions should be obtained from the applicable author or publisher of the image.
Full text @ PLoS Genet.