
|
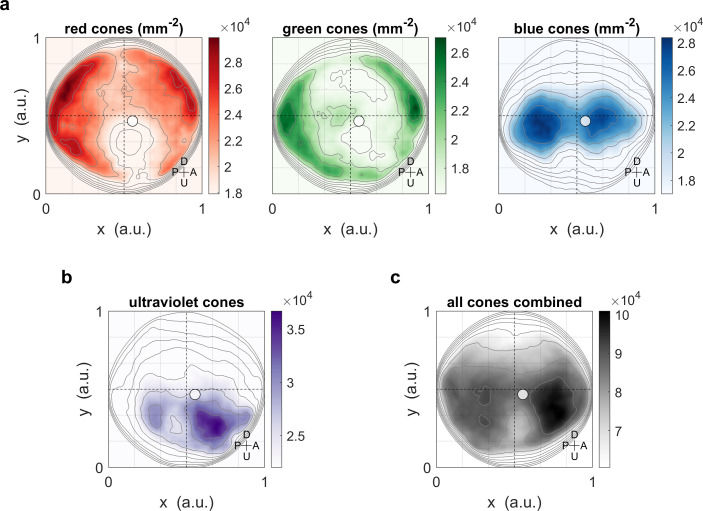
Figure 6—figure supplement 1. Same as Figure 6, but showing positions across the retina in Cartesian coordinates, as originally published (Zimmermann et al., 2018 Curr Biol), instead of in geographic visual field coordinates. When plotting photoreceptor densities in Cartesian coordinates, the regions of highest densities appear to be located quite peripheral/eccentric. However, the plot of the densities in visual field coordinates (Figure 6) confirms the coincidence of high densities and high OKR gains. Solid circles indicate the location of maximum OKR gain inferred from experiments of type D in 5-7 dpf larvae (Figure 3), and corrected by the mean eye position over time. U: Up, D: Down, A: Anterior, P: Posterior.