
|
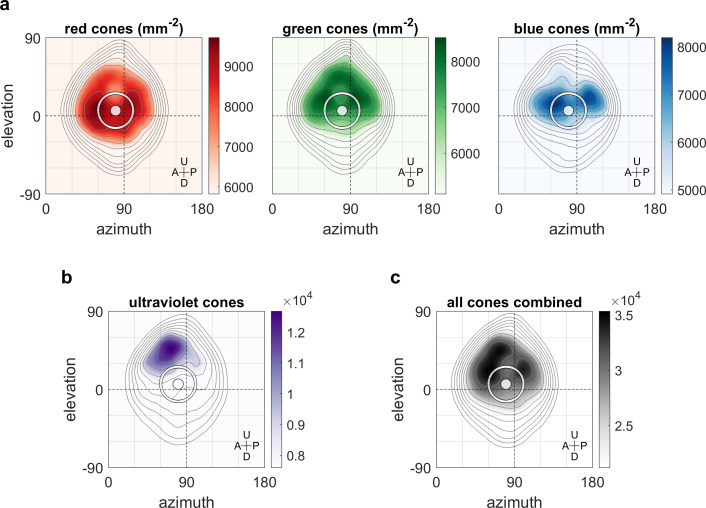
Figure 6—figure supplement 1. Contour lines show retinal photoreceptor density determined by optical measurements of explanted eye cups of 7–8 dpf zebrafish larvae, at increments of 10% of maximum density. Data shown in visual space coordinates relative to the body axis, that is, 90° azimuth and 0° elevation corresponds to a perfectly lateral direction. To highlight densely covered regions, densities from half-maximum to maximum are additionally shown in shades of colour. Solid white circles indicate the location of maximum OKR gain inferred from experiments of type D in 5-7dpf larvae (Figure 3). White outlines indicate the area that would be covered by a 40° disk-shaped stimulus centred on this location when the eye is in its resting position. As the eyes move within their beating field during OKR, the actual, non-stationary retinal coverage extends further rostrally and caudally. For (a) red, green, and blue photoreceptors, high densities coincide with high OKR gains. (b) For ultraviolet receptors, there is no clear relationship to the OKR gain. (c) For reference, the summed total density of all receptor types combined. We did not observe a significant shift in the position-dependence of maximum OKR gain between groups of larvae at 5, 6, or 7 dpf of age, consistent with the notion that retinal development is far advanced and the circuits governing OKR behaviour are stable at this developmental stage. U: Up, D: Down, A: Anterior, P: Posterior.