
Image
|
Figure Caption
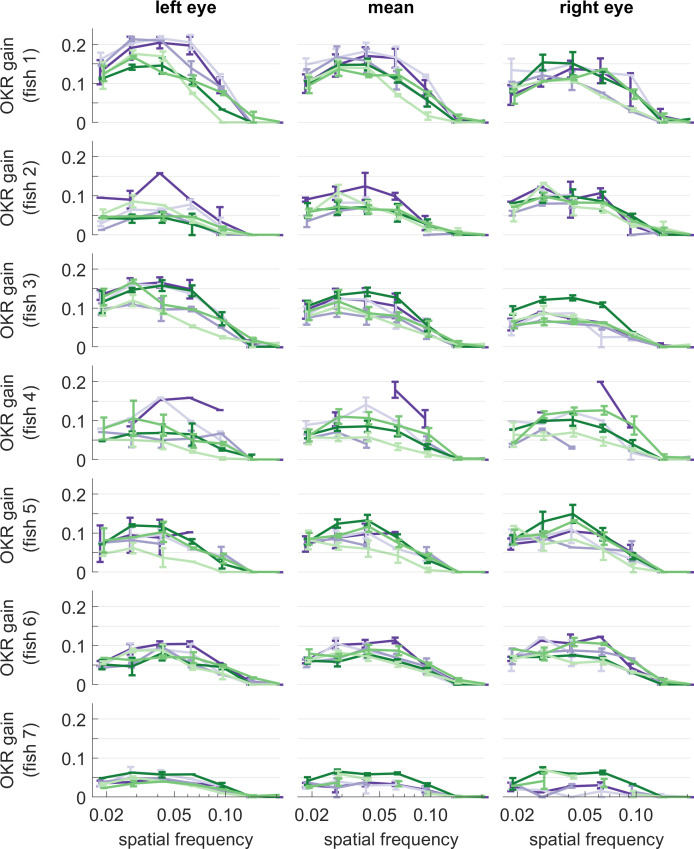
Figure 5—figure supplement 2.
Same colours as in Figure 5. Error bars show standard error of the mean. Data from n = 7 fish.
Acknowledgments
This image is the copyrighted work of the attributed author or publisher, and
ZFIN has permission only to display this image to its users.
Additional permissions should be obtained from the applicable author or publisher of the image.
Full text @ Elife