
|
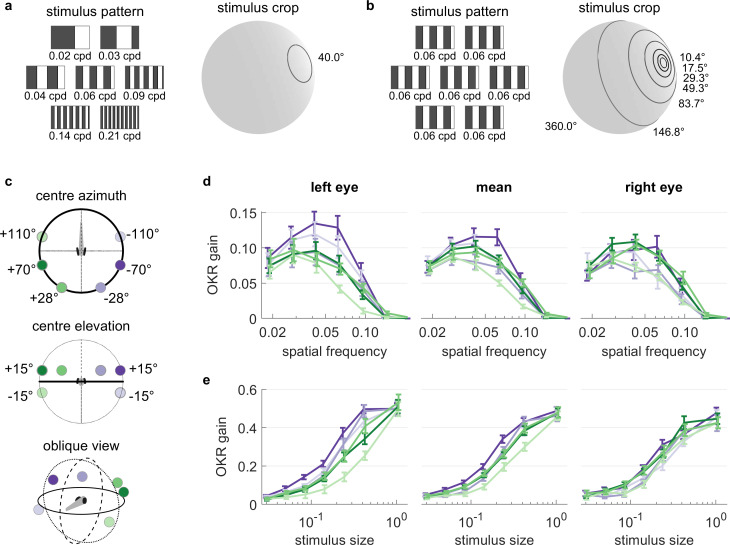
Figure 5 (a) Patterns with seven different frequencies were cropped to disks of a single size. These disks were placed in six different locations for a total of 42 stimuli. cpd: cycles per degree. (b) Patterns with identical spatial frequencies were cropped to disks of seven different sizes. These disks were also placed in six different locations for another set of 42 stimuli. Degrees indicate planar angles subtended by the stimulus outline, so 360° correspond to whole-field stimulation. (a, b) Displaying the entire actual pattern at the size of this figure would make the individual bars hard to distinguish. We thus only show a zoomed-in version of the patterns in which 45 out of 360 degrees azimuth are shown. (c) Coloured dots indicate the six locations on which stimuli from a and b were centred, shown from above (top), from front (middle), and from an oblique angle (bottom). (d) OKR gain is unimodally tuned to a wide range of spatial frequency (measured in cycles per degree). (e) OKR gain increases sigmoidally as the area covered by the visual stimulus increases logarithmically (a stimulus size of 1 corresponds to 100% of the spherical surface). (d–e) Colours correspond to the location of stimulus centres shown in (c). There is no consistent dependence on stimulus location of either frequency tuning or size tuning. Error bars show standard error of the mean. Data from n = 7 fish for frequency dependence and another n = 7 fish for size dependence.