Image
Figure Caption

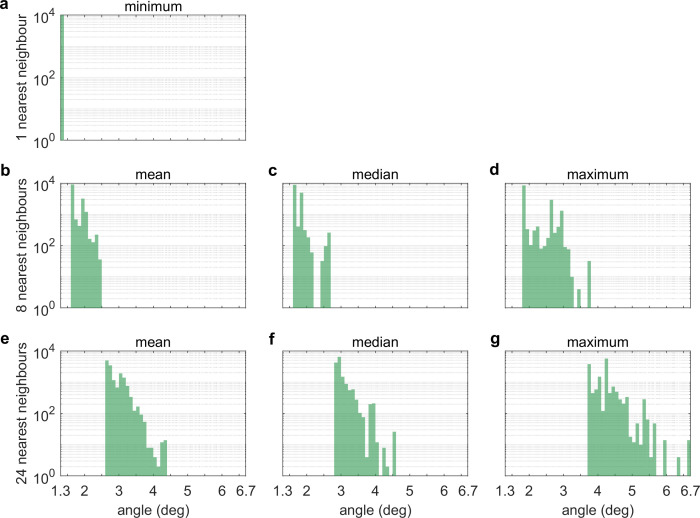
Figure 1—figure supplement 2. Nearest-neighbour distances between LEDs.

Histograms of (a) the angle between an LED and its nearest neighbour, (b) the mean, (c) median and (d) maximum angle between an LED and its eight nearest neighbours, and (e) the mean, (f) median and (g) maximum angle between an LED and its 24 nearest neigbours. Whereas (a) only captures the microstructure of LED tiles, where 8 by 8 LED are arranged in a square pattern, (b-d) and especially (e-g) also capture edge effects and gaps in between tiles.

Acknowledgments
This image is the copyrighted work of the attributed author or publisher, and ZFIN has permission only to display this image to its users. Additional permissions should be obtained from the applicable author or publisher of the image. Full text @ Elife