
|
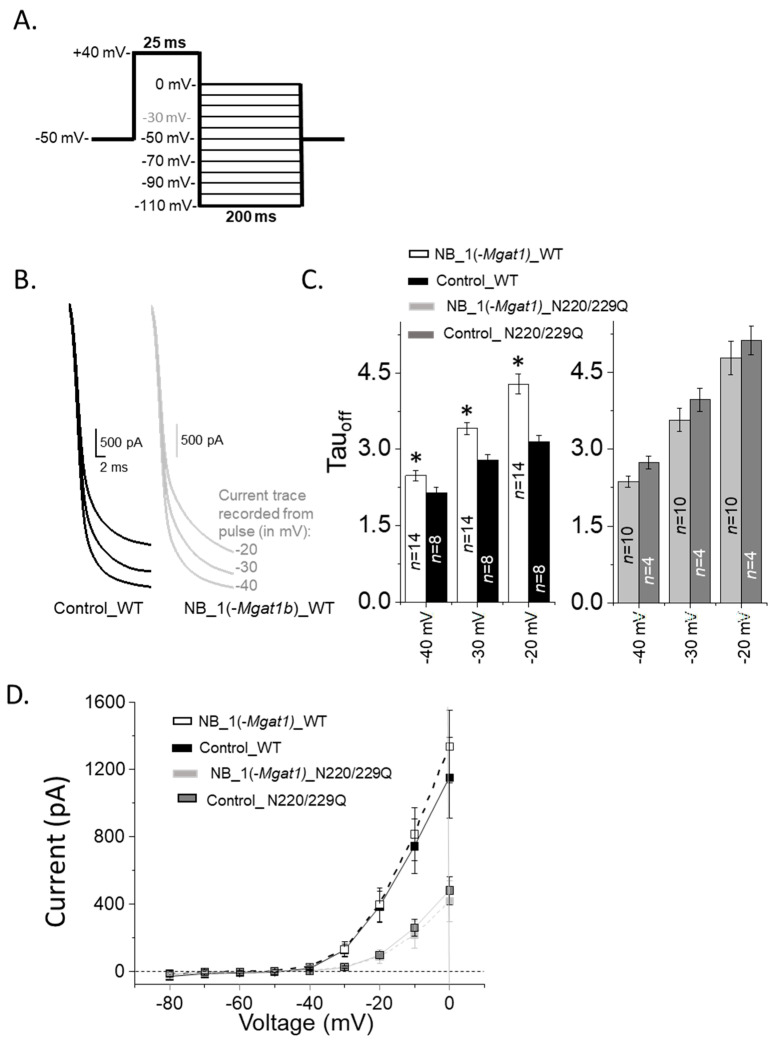
Figure 8 Closing rate of outward ionic current decreased as N-Glycan branching is lessened. (A) A deactivation protocol (left panel) was used to elicit whole currents (right panel) in NB cells stably expressing various forms of the Kv3.1b protein. (B) Expansion of deactivation currents at −40, −30 and −20 mV for glycosylated Kv3.1b expressed in parental (Control_WT) and glycosylated mutant (NB_1(-Mgat1)_WT) cells. (C) Deactivation time constants (Tauoff) of deactivation currents from WT Kv3.1 (left panel) and N220/229Q (right panel) expressing cell lines. (D) Current–voltage curves were obtained from the tail currents of the deactivation protocol for glycosylated (WT) and unglycosylated (N220/229Q) Kv3.1 α-subunits expressed in NB_1 and NB_1(-Mgat1). Data are presented as the mean ± SEM and were compared by Student’s t-test (* p < 0.05).