IMAGE

Figure 5

ID
ZDB-IMAGE-210617-81
Source
Figures for Hoffmann et al., 2021
Image
Figure Caption

Figure 5

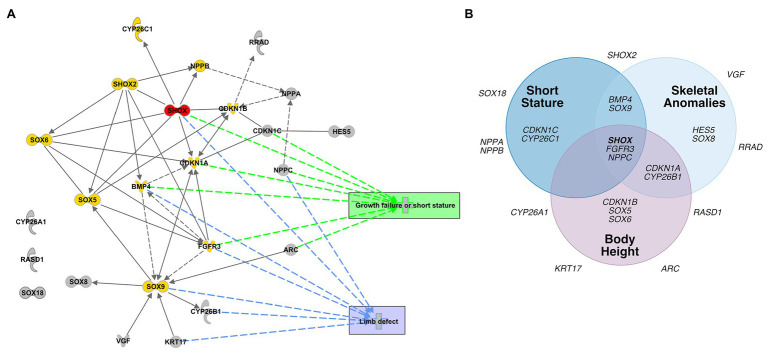
Database analyses of SHOX-regulated genes. (A) Network-based pathway analysis of SHOX-regulated genes using the Ingenuity pathway analysis (IPA) software. SHOX is highlighted in red. Known SHOX-associated genes are shown in yellow. Novel SHOX-regulated genes are shown in gray. Direct regulations are indicated by arrows and interactions as lines; indirect regulations or interactions are presented as dotted arrows/lines, respectively. The most important annotated pathways relevant to SHOX-associated diseases or function are highlighted in green (genes involved in growth failure and short stature) and blue (genes involved in limb defects). (B) Gene-disease association according to DisGeNET. Venn diagram showing associations between SHOX and 23 SHOX-regulated genes with respect to skeletal phenotypes based on the DisGeNET database (https://www.disgenet.org/home/; Pinero et al., 2015).

Acknowledgments
This image is the copyrighted work of the attributed author or publisher, and ZFIN has permission only to display this image to its users. Additional permissions should be obtained from the applicable author or publisher of the image. Full text @ Front Genet