IMAGE

Figure 2

ID
ZDB-IMAGE-210617-78
Source
Figures for Hoffmann et al., 2021
Image
Figure Caption

Figure 2

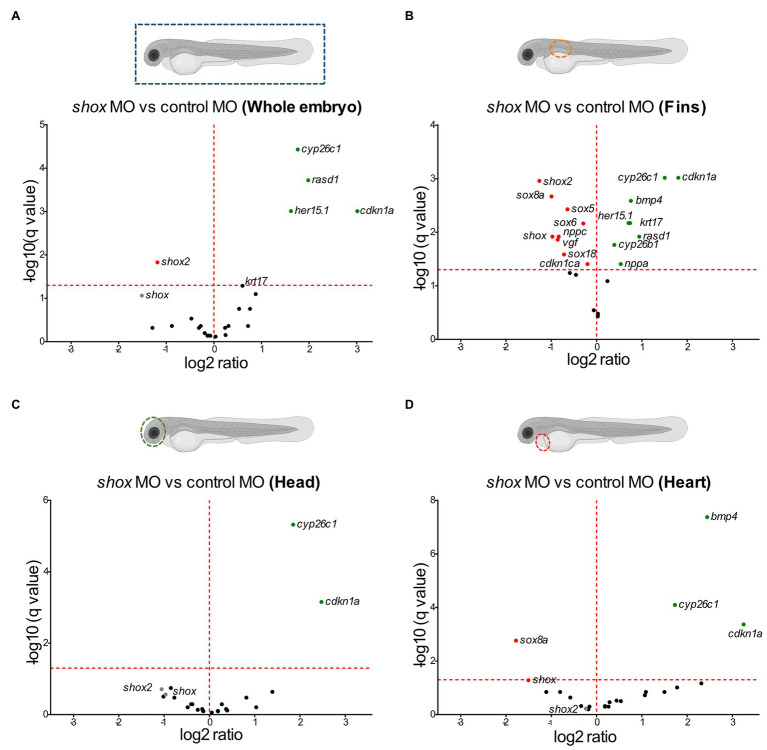
Tissue-specific validation of putative Shox target genes in zebrafish embryos after shox knockdown. Volcano plot presentations of expression ratio of selected shox target genes in (A) whole zebrafish tissue (n = 6 shox MO, n = 6 control MO), (B) fins (n = 3 shox MO, n = 3 control MO), (C) head (n = 4 shox MO, n = 4 control MO), and (D) heart (n = 4 shox MO, n = 5 control MO) at 55 hours post-fertilization (hpf) after morpholino-mediated knockdown of shox compared to controls. Genes above the red horizontal dashed line are significantly regulated. Genes shown to the left of the dashed vertical line are downregulated, those on the right are upregulated. Statistical significance was determined by multiple unpaired t-tests adjusted by the two-stage step-up method of Benjamini, Krieger, and Yekutieli (adjusted values of p = q-values). MO, morpholino.

Acknowledgments
This image is the copyrighted work of the attributed author or publisher, and ZFIN has permission only to display this image to its users. Additional permissions should be obtained from the applicable author or publisher of the image. Full text @ Front Genet