
|
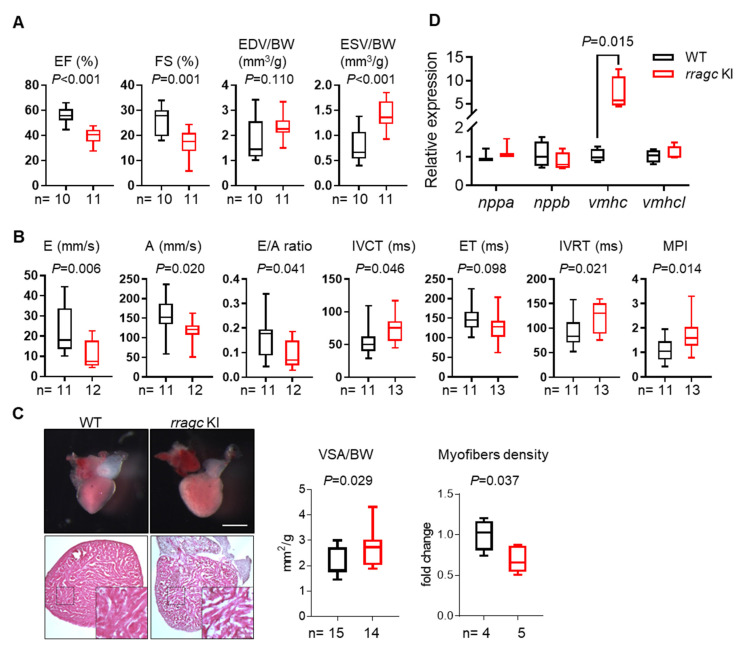
Figure 2 Characterizations of the cardiac phenotype of rragc KI fish at 7 months of age. (A) Echocardiographic measurements for WT (black) and rragc KI (red) fish. EF, ejection function. FS, fractional shortening. EDV, end-diastolic volume. ESV, end-systolic volume. BW, body weight. (B) High-frequency pulsed wave Doppler indices for WT and rragc KI fish at 7 months of age. E, early wave velocity. A, atrial wave velocity. IVCT, isovolumic contraction time. ET, ejection time. IVRT, isovolumic relaxation time. MPI, myocardium performance index, equals (IVCT + IVRT)/ET and was normalized to WT values. (C) Representative images of isolated hearts (upper panel) and H&E staining (lower panel), as well as corresponding quantification of the ventricular surface area (VSA) normalized to BW and trabecular muscle density in WT and rragc KI mutants. Scale bar = 0.5 mm. (D) RT-qPCR analysis of cardiomyopathy molecular markers in WT and rragc KI fish hearts (n = 4, each). Data were normalized to corresponding actb2 levels and rragc KI is expressed as the fold-change versus WT. nppa, natriuretic peptide A; nppb, natriuretic peptide B; vmhc, ventricular myosin heavy chain; vmhcl, ventricular myosin heavy chain-like. Data are shown in boxplot (MIN to MAX) and analyzed by Student’s t test.