IMAGE

Figure 2

ID
ZDB-IMAGE-210613-2
Source
Figures for Baker et al., 2021
Image
Figure Caption

Figure 2

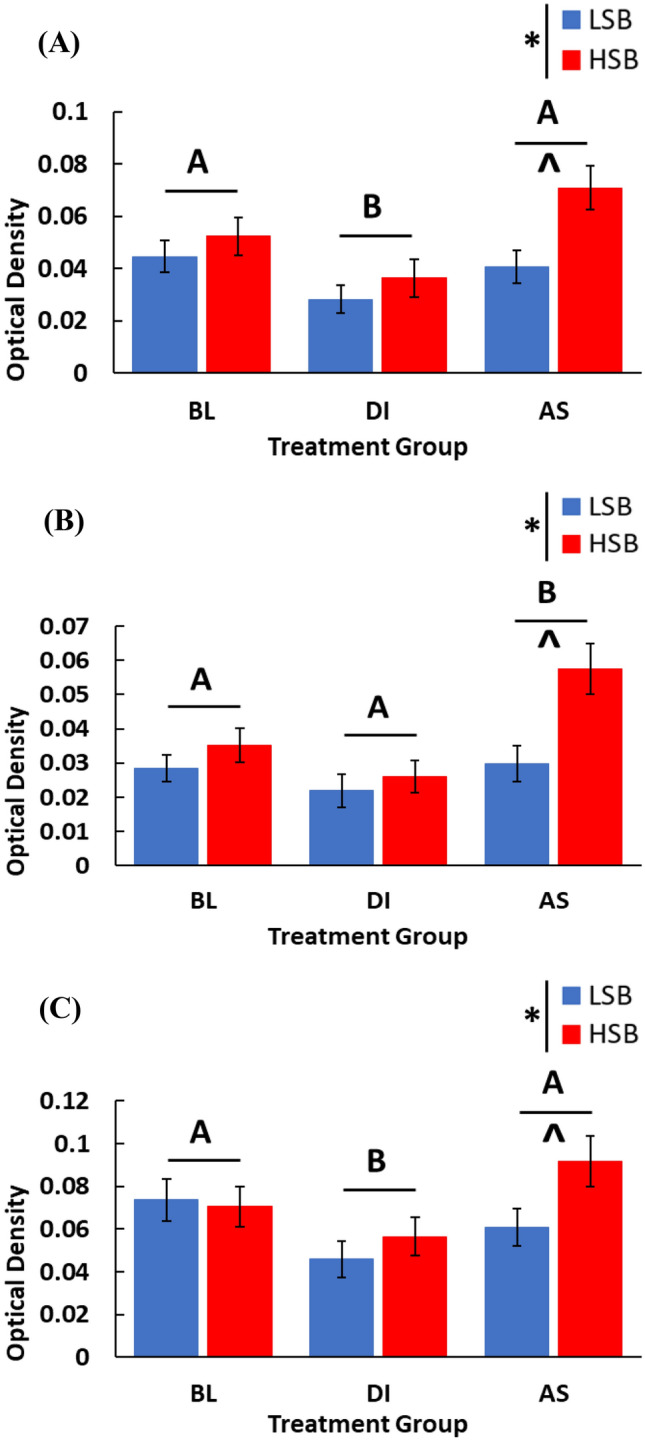
Expression of npas4a in the Dm (A), Dl (B), and Vs (C). We measured expression of high stationary behavior (HSB) and low stationary behavior (LSB) fish at baseline (BL) or exposed to either alarm substance (AS) or distilled water (DI) during training. Bars represent mean ± 1 SE. Bars labeled with different letters indicate p < 0.05. × Indicates a significant strain main effect. ^Indicates a significant within-treatment group strain difference.

Acknowledgments
This image is the copyrighted work of the attributed author or publisher, and ZFIN has permission only to display this image to its users. Additional permissions should be obtained from the applicable author or publisher of the image. Full text @ Sci. Rep.