
|
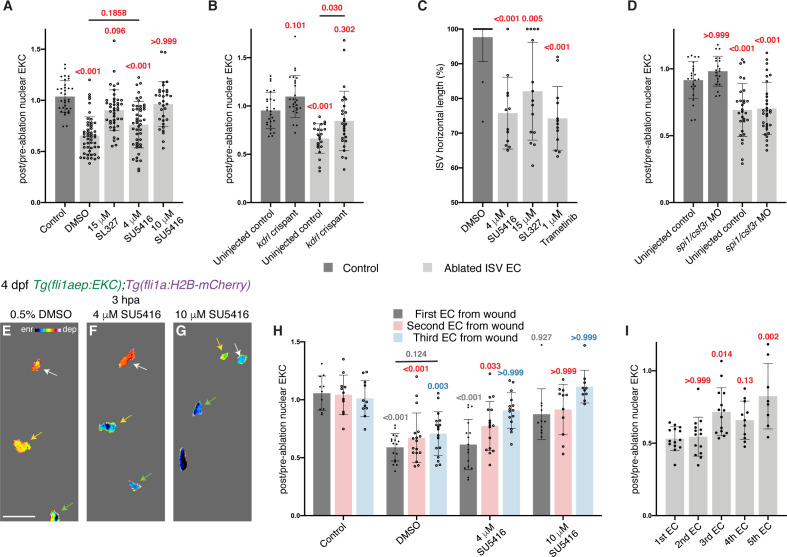
Figure 5 Erk activity in ablated vessels is maintained through the Vegfr pathway. (A) Ongoing Erk-signalling requires Vegfr and Mek activity. Quantification of post-/pre-ablation nuclear EKC intensity 3 hours post-ablation (hpa) in endothelial cells (ECs) of 0.5% dimethyl sulfoxide (DMSO)-treated non-ablated control ISVs (33 ECs, n = 11 larvae) and ablated ISVs of larvae treated with either 0.5% DMSO (51 ECs, n = 17 larvae), 15 μM SL327 (42 ECs, n = 14 larvae), 4 μM SU5416 (47 ECs, n = 16 larvae), or 10 μM SU5416 (32 ECs, n = 11 larvae). (B) Kdrl is required for full induction of Erk activity in ablated ISV ECs. Quantification of post-/pre-ablation nuclear EKC intensity 3 hpa in non-ablated control ISV ECs of uninjected control (27 ECs, n = 9 larvae) and kdrl crispants (26 ECs, n = 9 larvae), and ablated ISV ECs of uninjected control (22 ECs, n = 8 larvae) and kdrl crispants (27 ECs, n = 9 larvae). (C) Quantification of ISV horizontal length (as percentage of control) for ablated ISVs in 24 hpa, 5 days post-fertilisation (dpf), EC-EKC larvae treated with either 0.5% DMSO (n = 18 larvae), 4 μM SU5416 (n = 12 larvae), 15 μM SL327 (n = 15 larvae), or 1 μM Trametinib (n = 13 larvae). (D) Macrophages are not required for maintaining Erk activity in ablated ISV ECs. Quantification of post-/pre-ablation nuclear EKC intensity 3 hpa in non-ablated control ISV ECs of uninjected control (24 ECs, n = 8 larvae) and spi1/csf3r morphants (21 ECs, n = 7 larvae), and ablated ISV ECs of uninjected control (29 ECs, n = 10 larvae) and spi1/csf3r morphants (31 ECs, n = 11 larvae). (E–G) Lateral spinning disc confocal images of ablated ISV ECs in 4 dpf, 3 hpa, EC-EKC larvae treated with either 0.5% DMSO (E), 4 μM SU5416 (F), or 10 μM SU5416 (G). EC Erk activity was consistently higher and more Vegfr-dependent closer to the wound. Arrows indicate first (white), second (yellow), and third (green) ECs from the wounded site. Full images: Figure 5—figure supplement 1D’,H’,J’. (H) Quantification of post-/pre-ablation nuclear EKC intensity at 3 hpa in first (dark grey), second (red), and third (light blue) ECs from wound. Treatments were 0.5% DMSO-treated non-ablated control ISVs (11 first, second, and third ECs, n = 11 larvae), and ablated ISVs of larvae treated with either 0.5% DMSO (17 first, second, and third ECs, n = 17 larvae), 4 μM SU5416 (16 first and second ECs, and 15 third ECs, n = 16 larvae), or 10 μM SU5416 (11 first and second ECs, and 10 third ECs, n = 11 larvae). The same embryos were used in (A). (I) Quantification of post-/pre-ablation nuclear EKC intensity at 3 hpa in first (14 ECs, n = 14 larvae), second (14 ECs, n = 14 larvae), third (14 ECs, n = 14 larvae), forth (11 ECs, n = 11 larvae), and fifth (8 ECs, n = 8 larvae) ECs from the wounded site of ablated ISVs in 4 dpf EC-EKC larvae. Data for the first, second, and third ECs were taken from Figure 4—figure supplement 1N. ISV: intersegmental vessel; DA: dorsal aorta. Statistical test: Kruskal-Wallis test was conducted for graphs (A, C, D, H, I). Ordinary one-way ANOVA test was conducted for graph (B). Error bars represent standard deviation. 15 μm for image (E).