
|
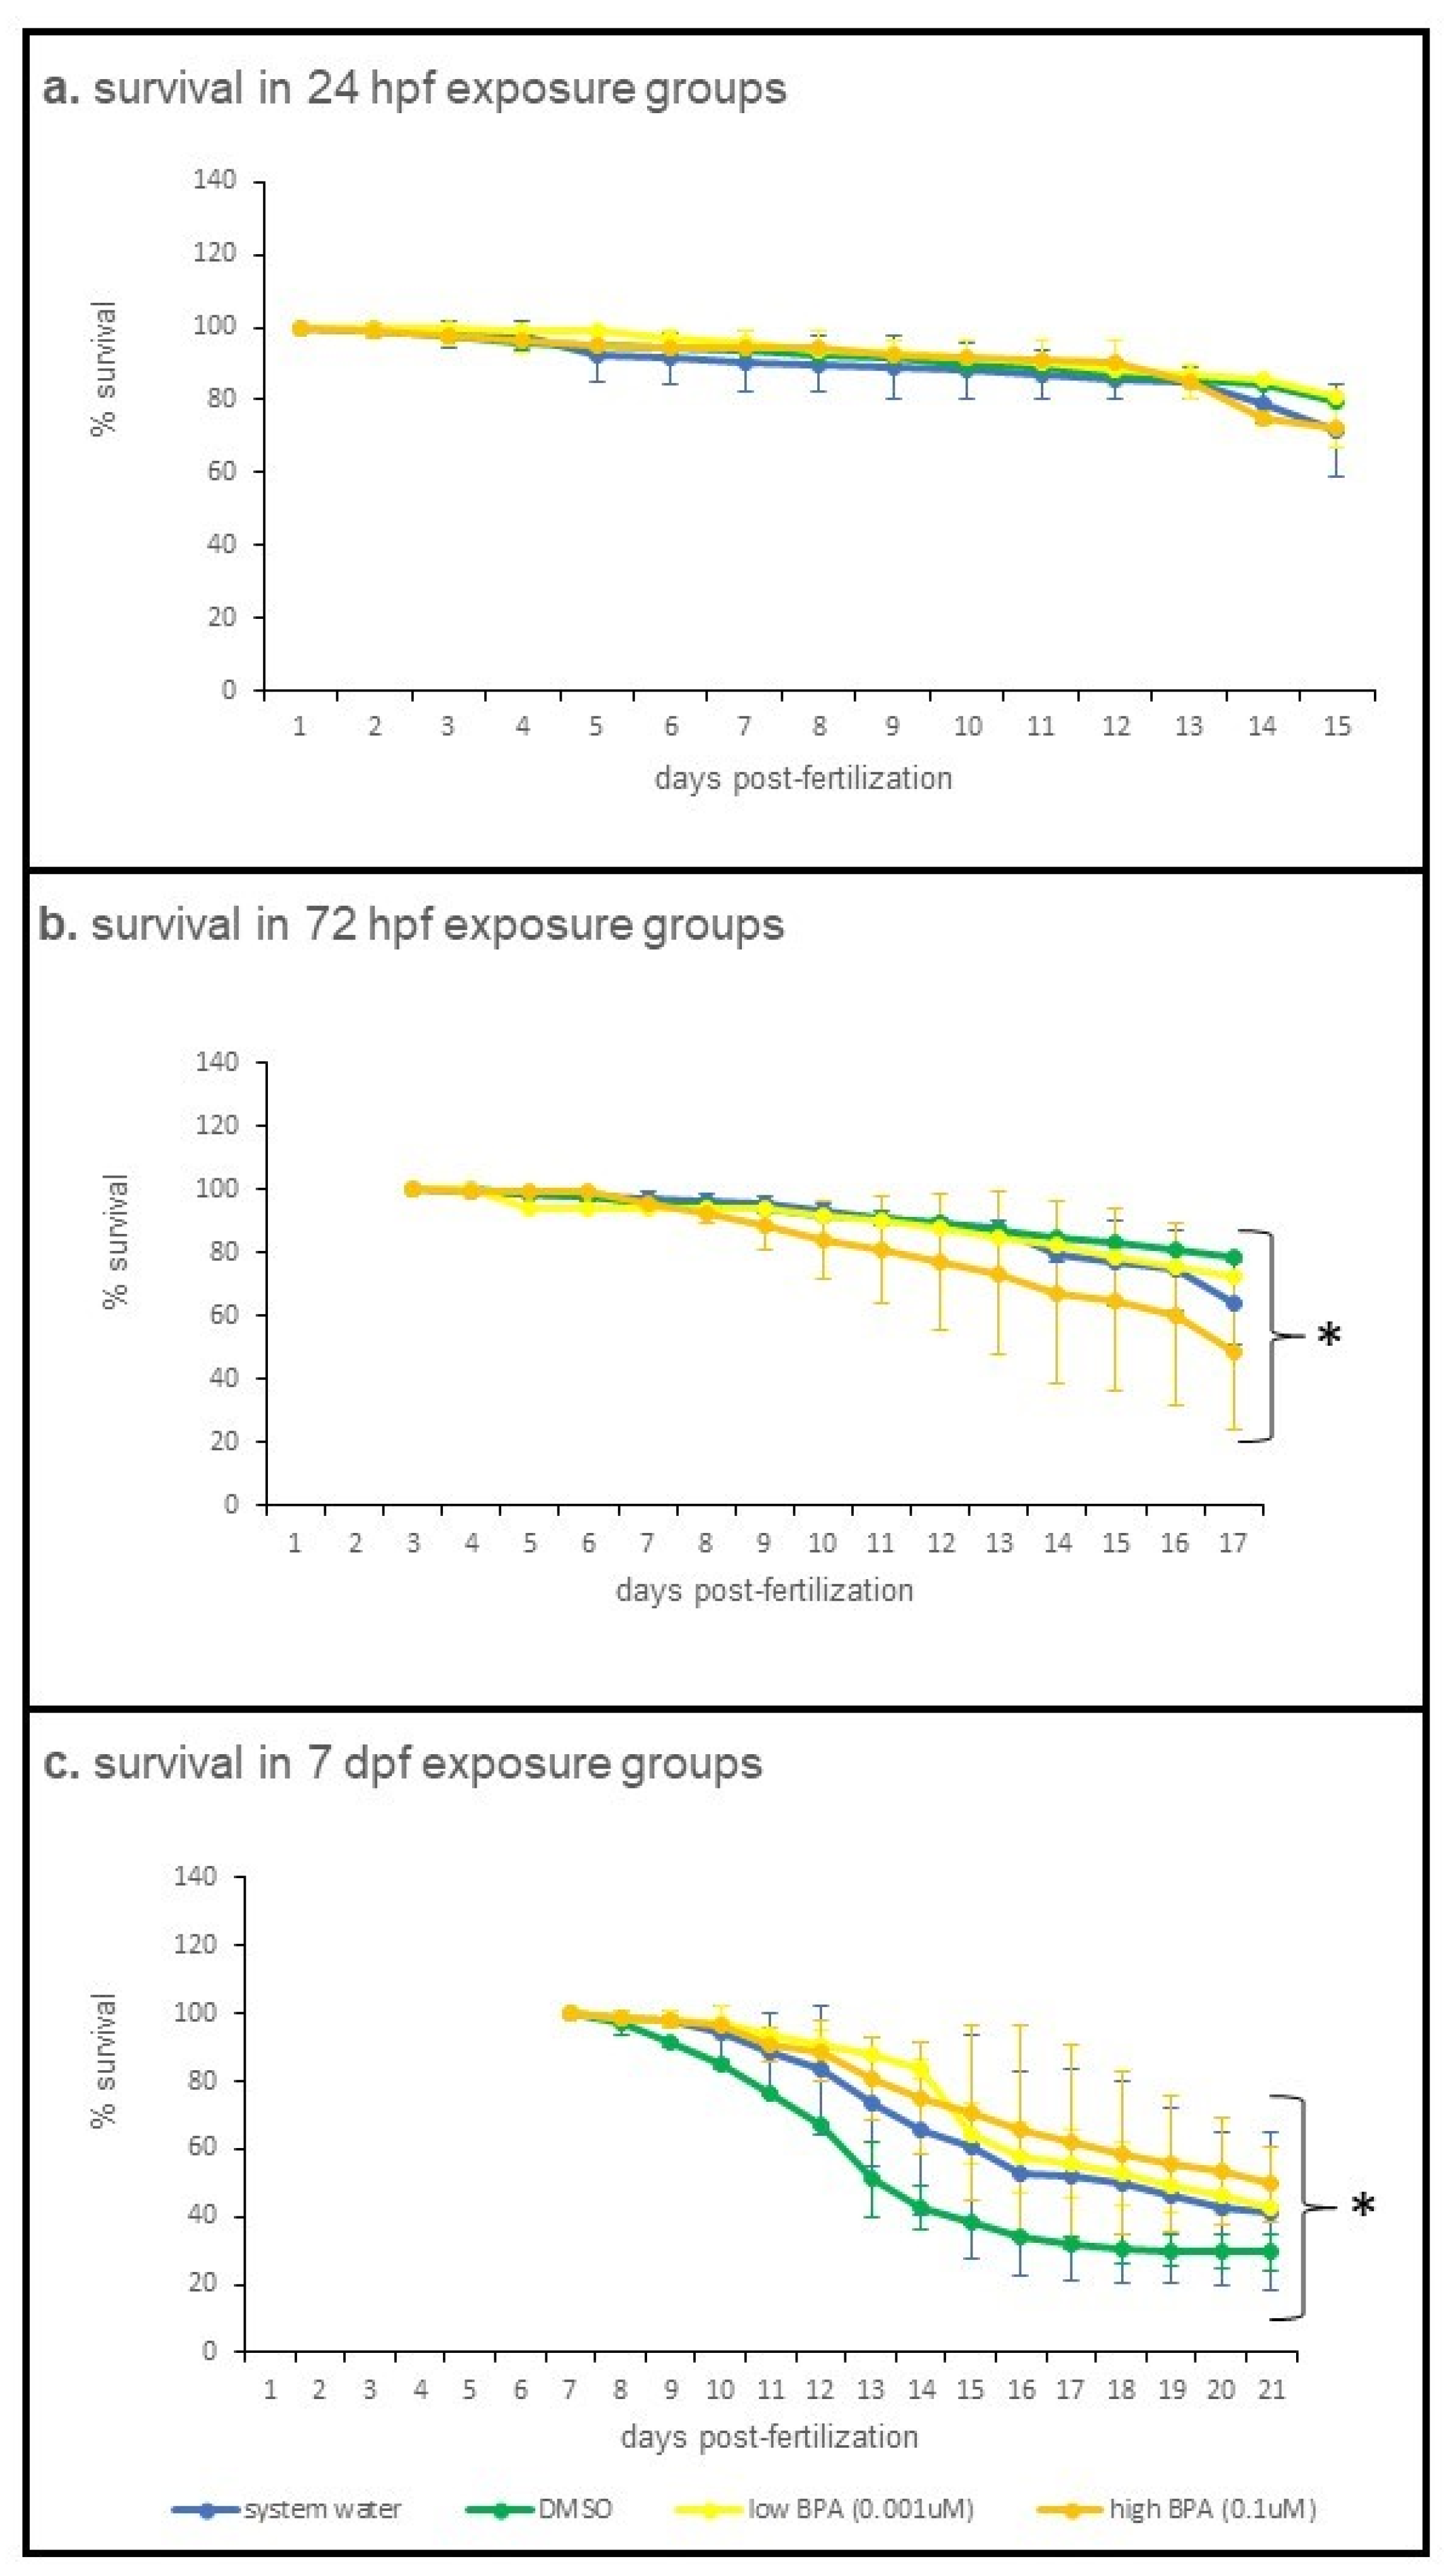
Fig. 1 Survival trends across all exposure ages and recovery sampling points. Survival was analyzed using a general linearized model, with treatment as the fixed factor and day as the co-variate. Values are reported as mean percent daily survival ± SD for each treatment group. (a) Overall daily survival of larvae exposed at 24 hpf was unaffected by treatment (p = 0.238). For 24 hpf exposures, initial populations were as follows: system water = 341; DMSO = 250; low BPA = 355; high BPA = 250. (b) Overall daily survival of larvae exposed at 72 hpf was significantly impacted by treatment (p < 0.001). For 72 hpf exposures, initial populations were system water = 293; DMSO = 250; low BPA = 298; high BPA = 250. (c) Overall daily survival of larvae exposed at 7 dpf was significantly impacted by treatment (p = 0.005). For the 7 dpf exposure groups, survival between treatment groups was assessed at 1 week and 2 week postexposure using one-way ANOVA, followed by a Tukey post hoc test; survival at these points was not significantly different: p = 0.191 at 1 week (14 dpf), and p = 0.811 at 2 weeks (21 dpf). For 7 dpf exposures, initial populations were system water = 231; DMSO = 221; low BPA = 293; high BPA = 226. Asterisks denote significant differences.