
|
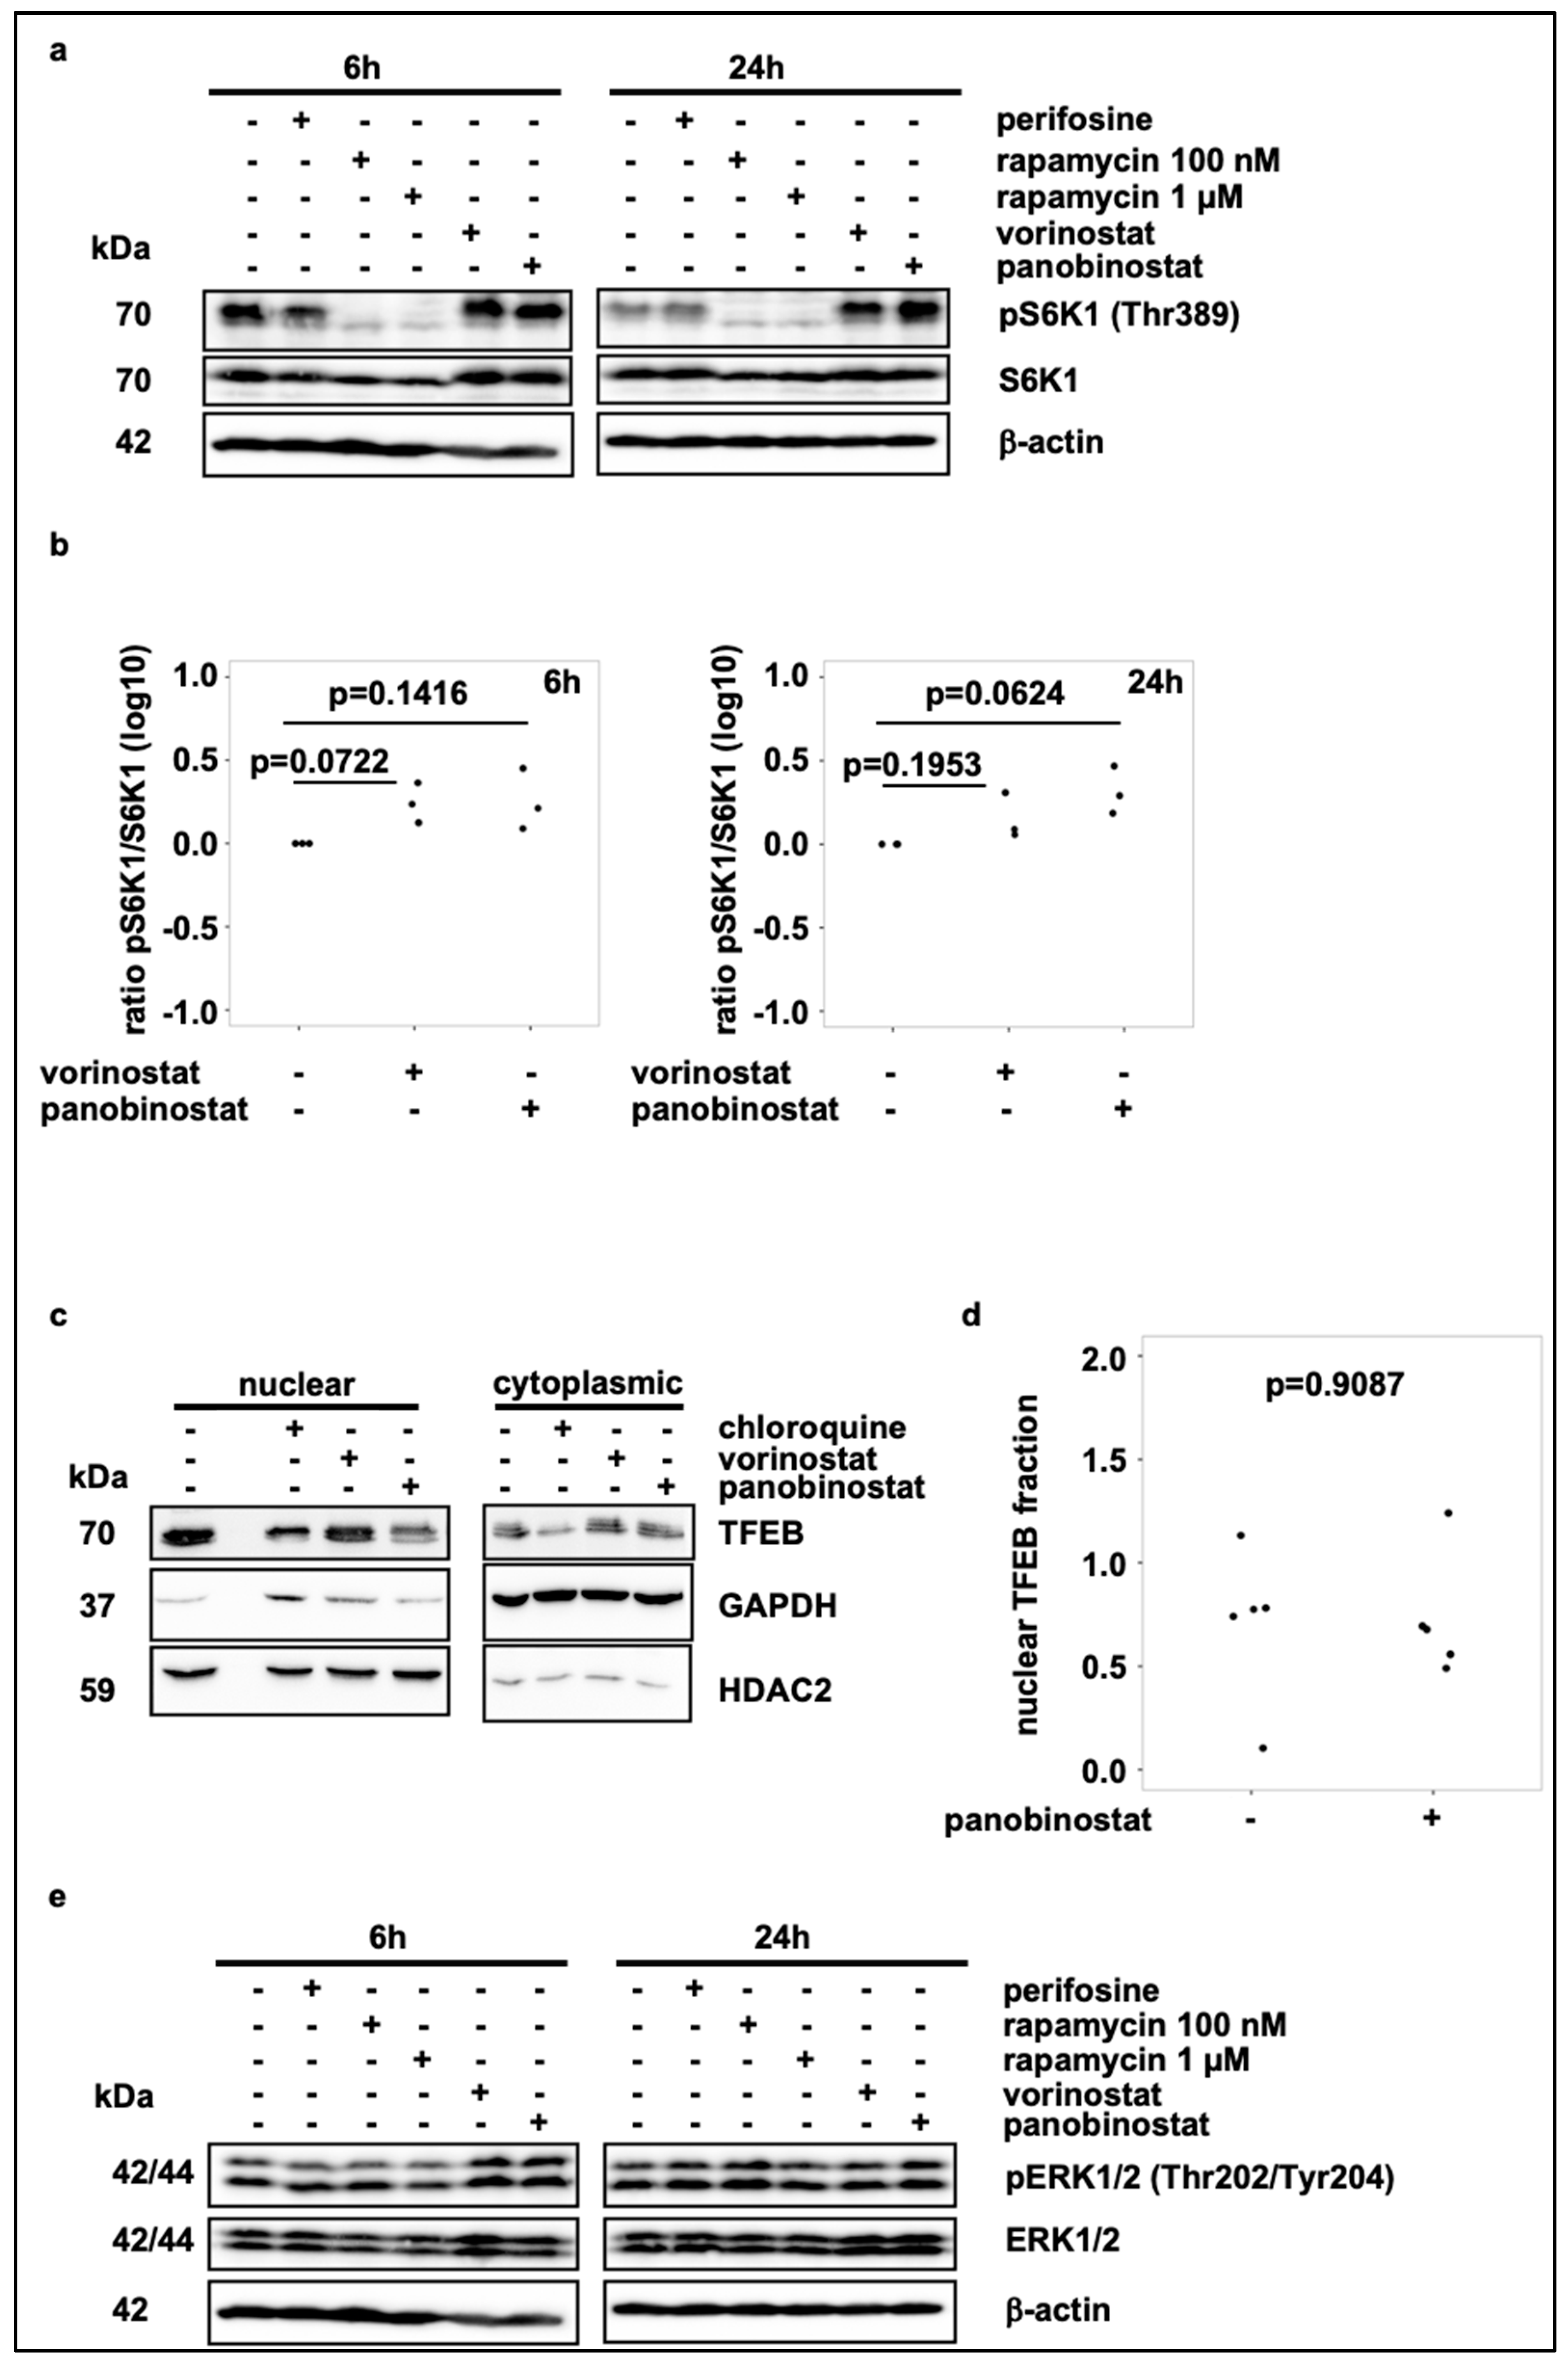
Fig. 3 Broad-spectrum HDAC inhibitor treatment does not reduce mTORC1 activity. (a) Western blot analysis of pS6K1 and S6K1 levels after 6 h and 24 h treatment with vorinostat (500 nM) or panobinostat (10 nM). Rapamycin (100 nM and 1 µM) was used as negative control for mTORC1 activity and thus S6K1 phosphorylation. Note that blots were also used to analyze ERK1/2 phosphorylation in Figure 3e. (b) Quantification of Western blot analysis of pS6K1 and S6K1 expression, normalized to solvent control. Statistical analyses: ANOVA with Tukey’s multiple comparison test. (c) Subcellular localization analysis of TFEB on SK-N-BE(2)-C cells treated for 24 h with vorinostat (500 nM) or panobinostat (10 nM). Chloroquine (50 µM) was used as positive control for TFEB translocation. GAPDH was used as cytoplasmic marker, HDAC2 was used as nuclear marker. (d) Quantification of nuclear TFEB by Western blot analysis from subcellular localization analysis. Statistical analyses: t-test. (e) Western blot analysis of pERK1/2 and ERK1/2 expression after 6 h and 24 h treatment with vorinostat (500 nM) or panobinostat (10 nM). Note that identical blots were used to analyze S6K1 phosphorylation in Figure 3a.