IMAGE

FIGURE 4

ID
ZDB-IMAGE-210520-40
Source
Figures for López-Cuevas et al., 2021
Image
Figure Caption

FIGURE 4

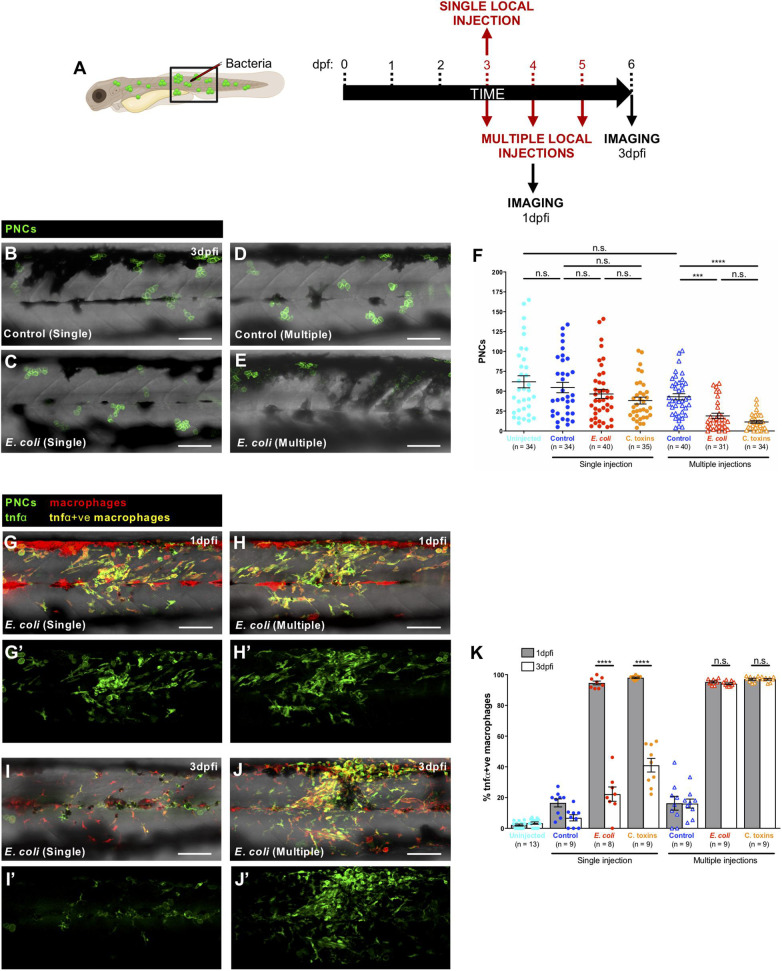
Prolonged pro-inflammatory response and reduction in cancer cell numbers upon consecutive local injections of E. coli or Coley’s toxins. (A) Schematic of the experimental timeline for single/multiple locally infected cancer studies showing the region (black box) to be imaged in (B–E,G–J). (B–E) Multi-channel confocal images of the flank of cancerous Tg(kita:HRASG12V-GFP) larvae showing pre-neoplastic cells (green) at 3 dpfi after single vs. multiple local injections of control media (B,D) or E. coli(C,E). (F) Graph showing number of pre-neoplastic cells following each treatment. (G–J) Multi-channel confocal images of the flank of cancerous Tg(kita:HRASG12V-GFP;mpeg1:mCherry;tnfα:GFP) showing pre-neoplastic cells (green) and tnfα-positive macrophages (yellow) (tnfα-negative macrophages are red) at 1 dpfi (G,H) or 3 dpfi (I,J) after single vs. multiple local injections of E. coli. (G’–J’) Single-channel confocal images of the same larvae showing GFP-expressing cells (pre-neoplastic cells and tnfα-positive cells). (K) Graph showing the percentage of tnfα-positive macrophages at two timepoints for all of the injection regimes. Scale bars = 100 μm.

Acknowledgments
This image is the copyrighted work of the attributed author or publisher, and ZFIN has permission only to display this image to its users. Additional permissions should be obtained from the applicable author or publisher of the image. Full text @ Front Cell Dev Biol