IMAGE

FIGURE 3

ID
ZDB-IMAGE-210520-39
Source
Figures for López-Cuevas et al., 2021
Image
Figure Caption

FIGURE 3

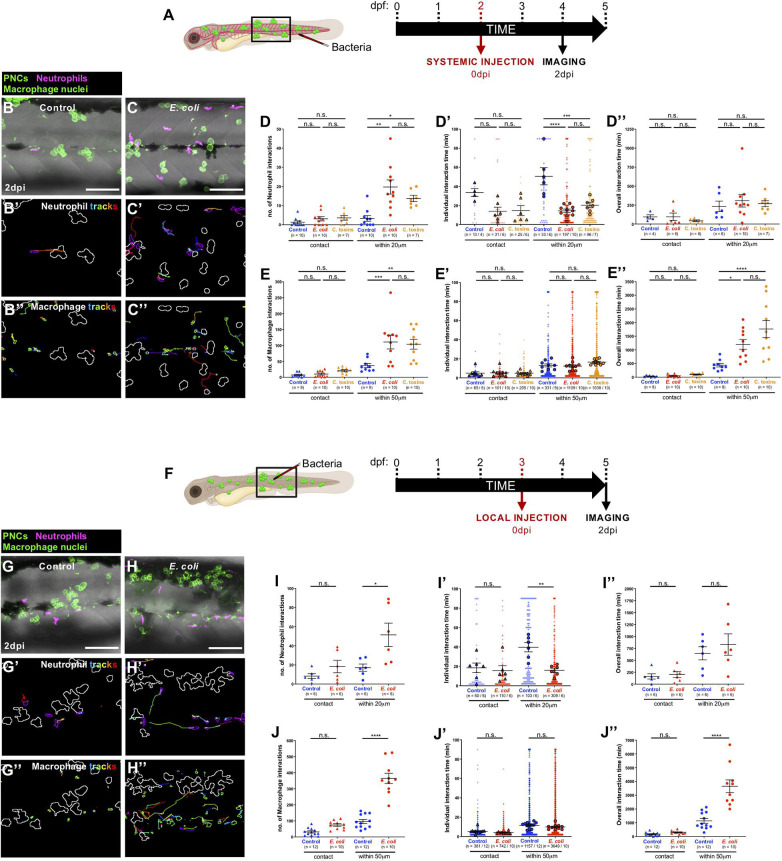
Altered cancer inflammatory response upon E. coli or Coley’s toxins infection. (A) Schematic of the experimental timeline for systemically infected cancer studies showing the region (black box) to be imaged in (B,C). (B,C) Multi-channel confocal movie frames of the flank of cancerous Tg(kita:HRASG12V-GFP;lyz:DsRed;mpeg1:nls-Clover) larvae at 2 dpi after systemic injection of control media (B) or E. coli(C), and prior to analysis of neutrophil (magenta) or macrophage (small green nuclei) behaviour and their interactions with pre-neoplastic cells (large green cells). (B’,C’,B”,C”) Post-software images of the same larvae showing neutrophils (magenta) (B’,C’) or macrophage nuclei (green) (B”,C”) and their tracks in the vicinity of pre-neoplastic clones (white lines indicate clonal margins). (D,E,D’,E’,D”,E”). Graphs showing number and individual/overall duration of neutrophil-cancer (D,D’,D”) and macrophage-cancer (E,E’,E”) interactions. (F) Schematic of the experimental timeline for locally infected cancer studies showing the region (black box) to be imaged in (G,H). (G–J,G’–J’,G”–J”) The same analysis was carried out for local infection as previously described for the systemic infection experiments. Scale bars = 100 μm.

Acknowledgments
This image is the copyrighted work of the attributed author or publisher, and ZFIN has permission only to display this image to its users. Additional permissions should be obtained from the applicable author or publisher of the image. Full text @ Front Cell Dev Biol