IMAGE

FIGURE 2

ID
ZDB-IMAGE-210520-38
Source
Figures for López-Cuevas et al., 2021
Image
Figure Caption

FIGURE 2

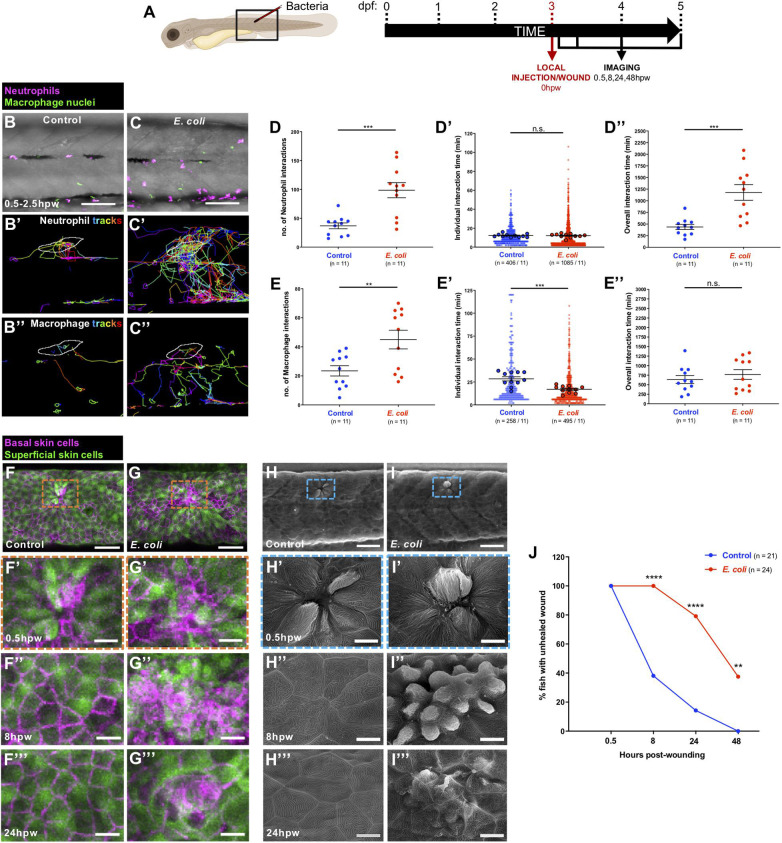
Alterations to the wound inflammatory response upon E. coli infection and consequences for tissue repair. (A) Schematic of the experimental timeline for locally infected flank wound studies showing the region (black box) to be imaged in (B,C,F–I). (B,C) Multi-channel confocal movie frames of flank wounded Tg(lyz:DsRed;mpeg1:nls-Clover) larvae at 0.5 hpw after local injection of control media (B) or E. coli(C), and prior to analysis of neutrophil (magenta) or macrophage (green nuclei) behaviour and their interactions with the wound. (B’,C’,B”,C”) Post-software images of the same larvae showing neutrophils (magenta) (B’,C’) or macrophage nuclei (green) (B”,C”) and their tracks towards the wound (white lines indicate wound margins). (D,E,D’,E’,D”,E”) Graphs showing number and individual/overall duration of neutrophil-wound (D,D’,D”) and macrophage-wound (E,E’,E”) interactions. (F,G) Multi-channel confocal images of flank wounded Tg(krt4:GFP;krt19:tdTomato-CAAX) larvae showing the disposition of the larval zebrafish skin superficial (green) and basal (magenta) cell layers at 0.5 hpw in control (F) or E. coli-injected fish (G). (H,I) Scanning electron micrographs of flank wounded larvae at 0.5 hpw after local injection of control media (H) or E. coli(I). (F’–I’,F”–I”,F”’–I”’) Higher magnification views of wound regions from (F–I) at 0.5 hpw (F’–I’), 8 hpw (F”–I”), and 24 hpw (F”’–I”’). (J) Graph showing rate of healing in infected vs. uninfected wounds. Scale bars = 100 μm in (B,C), 75 μm in (F,G), 50 μm in (H,I), 20 μm in (F’,G’,F”,G”,F”’,G”’), 10 μm in (H’,I’,H”,I”,H”’,I”’).

Acknowledgments
This image is the copyrighted work of the attributed author or publisher, and ZFIN has permission only to display this image to its users. Additional permissions should be obtained from the applicable author or publisher of the image. Full text @ Front Cell Dev Biol