IMAGE

FIGURE 1

ID
ZDB-IMAGE-210520-37
Source
Figures for López-Cuevas et al., 2021
Image
Figure Caption

FIGURE 1

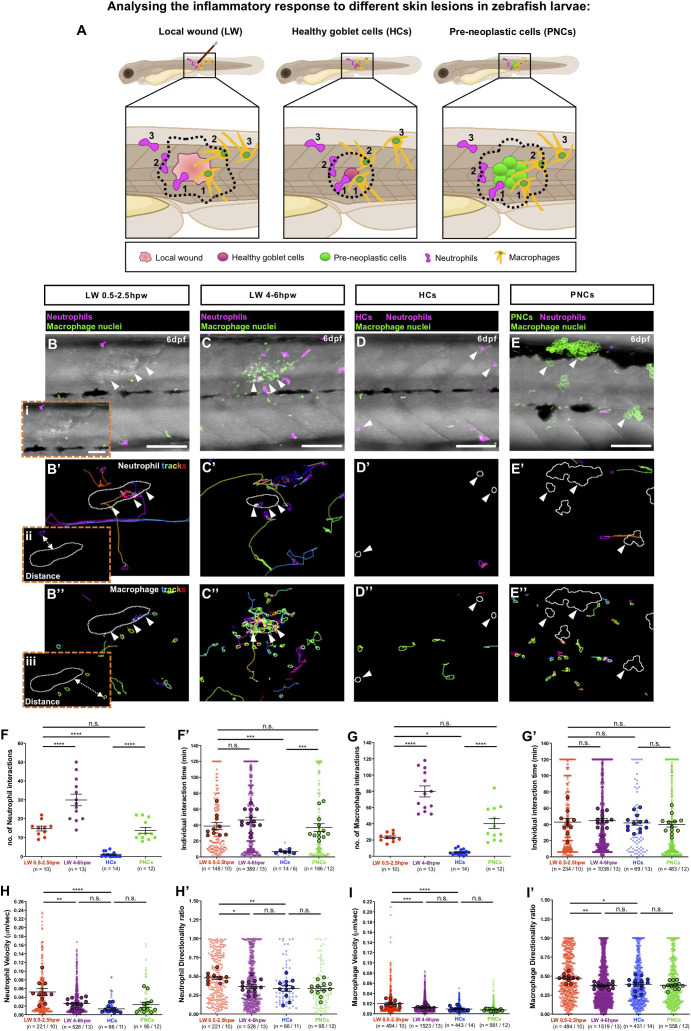
Analysing the inflammatory response to different skin lesions in zebrafish larvae. (A) Schematic to illustrate our cancer-wound comparison studies showing the region (black box) to be imaged in (B–E), for neutrophils (magenta) and macrophages (orange) as they respond to the different skin lesions: local wound (LW), healthy RFP-expressing goblet cells (HCs) or pre-neoplastic GFP-expressing goblet cells (PNCs); dotted lines indicate the “close proximity” zone from margins of each lesion type; 1 and 2 indicate immune cells in contact with the lesion or within “close proximity”, respectively, and 3 indicates immune cells outside this zone. (B–E) Multi-channel confocal movie frames of 6 dpf flank wounded Tg(lyz:DsRed;mpeg1:nls-Clover) (B,C), unwounded control Tg(kita:mCherry; lyz:DsRed;mpeg1:nls-Clover) (D) or cancerous Tg(kita:HRASG12V-GFP;lyz:DsRed;mpeg1:nls-Clover) (E) larvae prior to analysis of neutrophil (magenta) or macrophage (green nuclei) behaviour and their interactions with the respective skin lesions (white arrowheads). (B’–E’,B”–E”) Post-software images of the same larvae showing neutrophils (magenta) (B’–E’) or macrophage nuclei (green) (B”–E”) and their tracks in the vicinity of the lesion (white lines indicate lesion margins). (i–iii) Higher magnification views from (B,B’,B”) showing the “cell-to-cell” distance between neutrophil cytoplasmic (ii) or macrophage nuclear (iii) margins to lesion margins. (F,G,F’,G’) Graphs showing number and duration of neutrophil-lesion (F,F’) and macrophage-lesion (G,G’) interactions. (H,I,H’,I’) Graphs showing velocity and directionality ratio of neutrophils (H,H’) and macrophages (I,I’) quantified at the lesion site. Scale bars = 100 μm in (B–E), 50 μm in (Bi).

Acknowledgments
This image is the copyrighted work of the attributed author or publisher, and ZFIN has permission only to display this image to its users. Additional permissions should be obtained from the applicable author or publisher of the image. Full text @ Front Cell Dev Biol