IMAGE

FIGURE 3

ID
ZDB-IMAGE-210520-11
Source
Figures for Liu et al., 2021
Image
Figure Caption

FIGURE 3

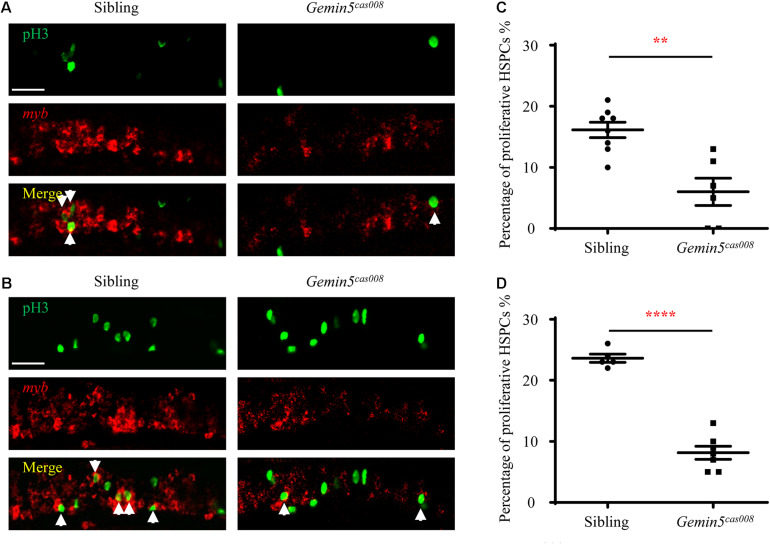
Decreased HSPCs proliferation in mutant gemin5cas008. (A,B) Representative confocal images of double staining of pH3 protein (green) and myb RNA (red) in the CHT at 4 dpf (A) and 5 dpf (B). Arrows point at proliferative HSPCs. Scale bars, 50 μm. (C,D) Percentage of proliferative HSPCs (pH3+myb+)/ total HSPCs (myb+) in sibling and gemin5cas008 embryos at 4 dpf (C) and 5 dpf (D). (C)t = 4.202, df = 12, and P = 0.0012. (D)t = 10.96, df = 10, and P < 0.0001.

Acknowledgments
This image is the copyrighted work of the attributed author or publisher, and ZFIN has permission only to display this image to its users. Additional permissions should be obtained from the applicable author or publisher of the image. Full text @ Front Cell Dev Biol