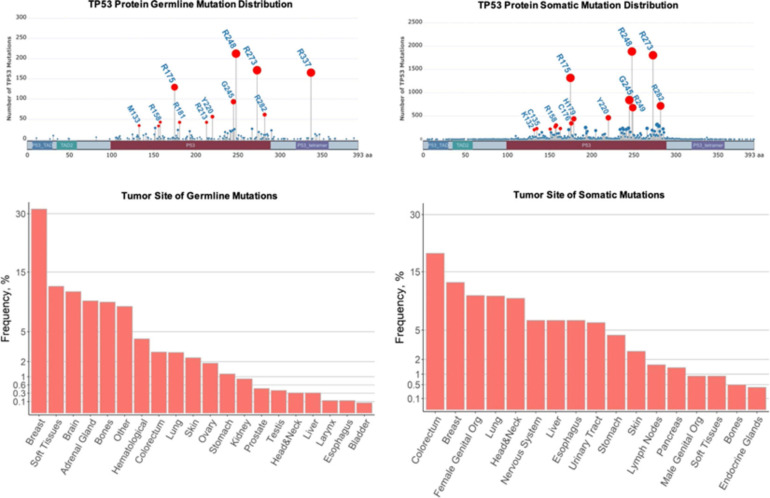
IMAGE

FIGURE 2

ID
ZDB-IMAGE-210518-59
Source
Figures for Kobar et al., 2021
Image
Figure Caption

FIGURE 2

Comparison of germline and sporadic TP53 mutations found in human cancers. Top row: Germline and somatic missense mutations have been mapped to specific TP53 residues and domains. The frequencies of the mutations in selected hot-spot residues are indicated by the height of lollipop graph elements and the size of their circles. The circles of selected mutations are highlighted in red and the residues are labeled. The total numbers of germline and somatic mutations recorded are different in IARC TP53 datasets. Bottom row: Tissues associated with tumors due to germline and somatic TP53 mutations. The frequencies are represented as percentages of the total recorded tumors. In the plot, these percentages are scaled by the square root to visualize less frequent tissues. Plots were constructed using G3viz and ggplot2 R packages based on the IARC TP53 database (https://p53.iarc.fr/) after limiting the datasets to the missense mutations.

Acknowledgments
This image is the copyrighted work of the attributed author or publisher, and ZFIN has permission only to display this image to its users. Additional permissions should be obtained from the applicable author or publisher of the image. Full text @ Front Cell Dev Biol