
|
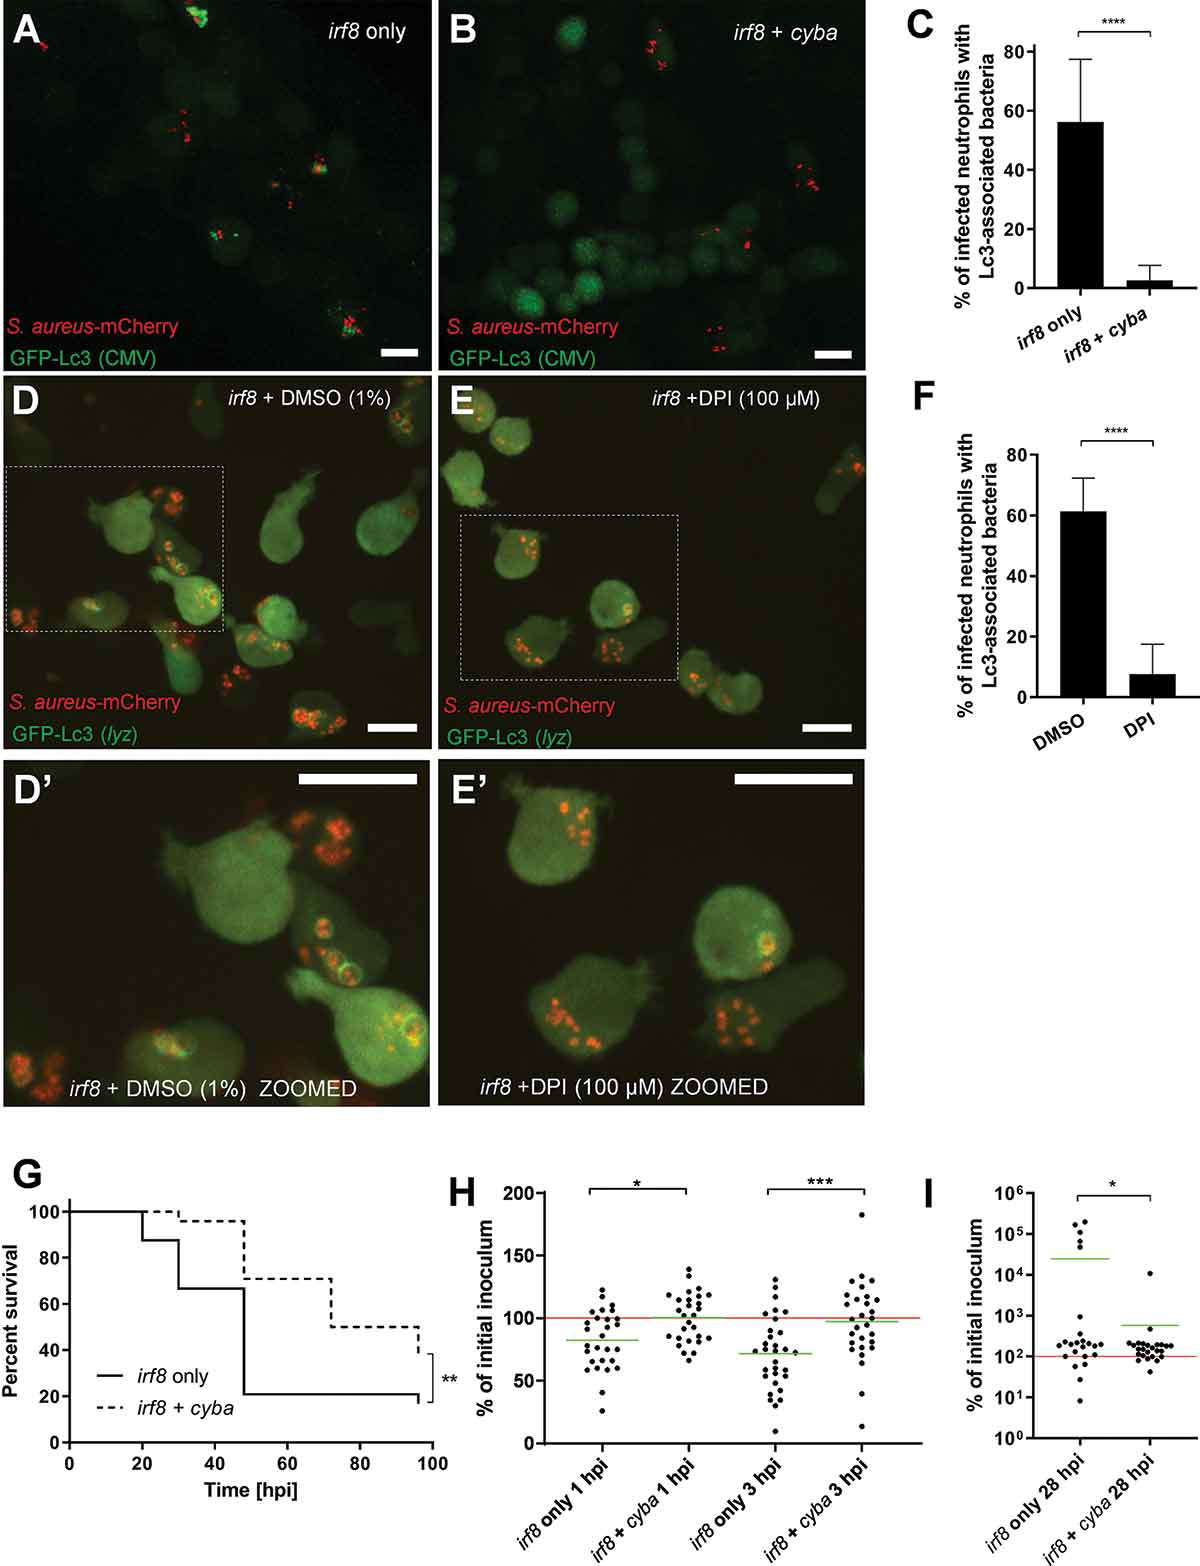
Fig. 4 Formation of NADPH oxidase-dependent Lc3-positive vesicles containing S. aureus in neutrophils is detrimental for the infected host. (A and B) Confocal photomicrographs are shown as maximum intensity projections of the Lc3-mediated response at 1 hpi in irf8-only (A) and irf8 + cyba knockdown (B) fixed CMV:GFP-Lc3 embryos infected with approximately 1500 CFU of mCherry-labeled S. aureus. Scale bars: 10 µm. (C) Quantification of Lc3 associations with intracellular S. aureus within infected neutrophils of irf8-only and irf8 + cyba knockdown fixed CMV:GFP-Lc3 embryos at 1 hpi with approximately 1500 CFU. Data are shown as mean ± standard deviation (SD) obtained from three independent experiments (5–6 larvae per experiment per group). 174 infected neutrophils in 16 irf8-only knockdown larvae were analyzed. 210 infected neutrophils in 17 irf8 + cyba knockdown larvae were analyzed. Unpaired two-tailed t-test was used. **** P < 0.0001. (D and E) Confocal photomicrographs are shown as maximum intensity projections of the Lc3-mediated response at 1 hpi in control (DMSO) (D) and DPI-treated (E) irf8 knockdown live lyz:RFP-GFP-Lc3 embryos infected with approximately 1500 CFU of mCherry-labeled S. aureus. The images shown are representative of three independent experiments. Scale bars: 10 µm. (D’ and E’). Zoomed-in fragments of photomicrographs d and e. (F) Quantification of Lc3 associations with intracellular S. aureus within infected neutrophils of control (DMSO) and DPI-treated irf8 knockdown live lyz:RFP-GFP-Lc3 embryos at 1 hpi with approximately 1500 CFU. Data are shown as mean ± standard deviation (SD) obtained from three independent experiments. 252 infected neutrophils in 18 DMSO-treated larvae were analyzed. 208 infected neutrophils in 17 DPI-treated larvae were analyzed. Unpaired two-tailed t-test was used.**** P < 0.0001. (G) Survival of irf8-only or irf8 + cyba knockdown zebrafish larvae following intravenous injection with approximately 1500 CFU of S. aureus at 30 hpf (25 larvae per group). This result is representative of three independent experiments. Survival curves were compared using a log-rank (Mantel-Cox) statistical test. ** P < 0.01. (H and I) The CFU counts of the irf8-only or irf8 + cyba knockdown larvae infected intravenously with approximately 1500 CFU of S. aureus at 1 and 3 hpi (H) or 28 hpi (I). At each timepoint, larvae were sacrificed, homogenized, and the recovered staphylococci were enumerated by serial dilutions. The red line represents the level of the initial inoculum, whereas the green lines represent the mean value of each group. Data are obtained from 3 independent experiments (n of larvae per timepoint ≥24). One-way ANOVA with Bonferroni’s posttest was used for (H) and an unpaired two-tailed t-test was used for (I). * P < 0.05, *** P < 0.001