
|
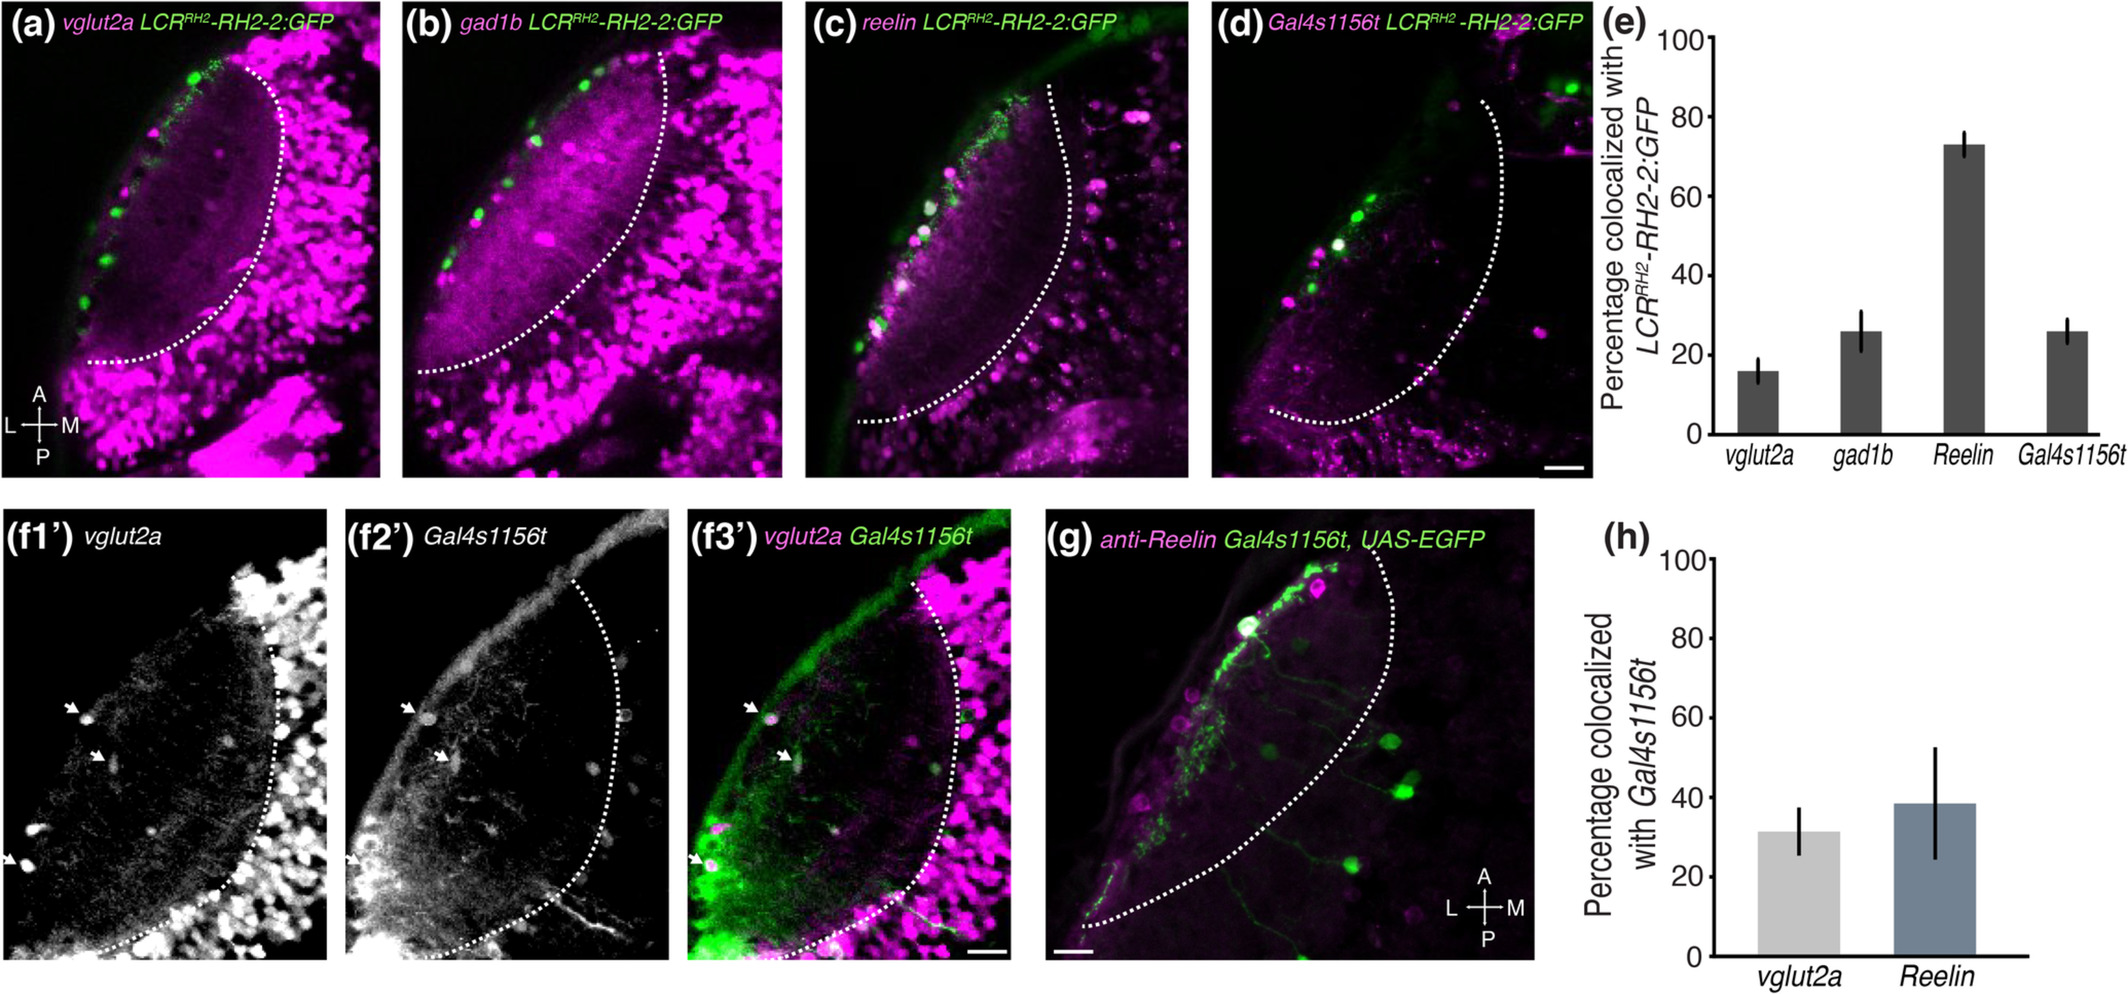
Fig. 7 SINs are molecularly heterogeneous. (a–d) Representative examples of LCRRH2‐RH2‐2:GFP+ SINs, colabeled with previously identified SIN markers. (a) Crossing LCRRH2‐RH2‐2:GFP (green) to vglut2a:loxP‐DsRed‐loxP‐GFP (magenta) shows a small number of SINs express Vglut2a. Some, but not all, vglut2a+ SINs colocalize with GFP. (b) Crossing LCRRH2‐RH2‐2:GFP (green) to gad1b:loxP‐DsRed‐loxP‐GFP (magenta) shows that some, but not all, gad1b+ SINs colocalize with GFP. (c) Crossing LCRRH2‐RH2‐2:GFP (green) to reelin:Gal4 × UAS:RFP (magenta) shows that most GFP+ cells are reelin+. (d) Crossing LCRRH2‐RH2‐2:GFP to Gal4s1156t × UAS:RFP shows that some, but not all, GFP+ SINs are Gal4s1156t+. (e) Percentage of colocalized LCRRH2‐RH2‐2:GFP+ SINs with each of the marker lines tested in (a‐d) (n = 5 larvae, each condition). (f1′–f3′) Some, but not all, Gal4s1156t+ SINs colocalize with vglut2a:loxP‐DsRed‐loxP‐GFP (magenta). Individual channels are shown for vglut2a (f1′) and Gal4s1156t (f2′) signal in addition to the merged image (f3′). White arrows denote three examples of colocalization. (g) Some, but not all, Gal4s1156t+ SINs are reelin+. Representative immunostaining of a 8 dpf Gal4s1156t × UAS:EGFP larva stained with anti‐GFP (green) and anti‐Reelin (magenta). (h) Percentage of colocalized GFP+ SINs in Gal4s1156t with each reelin or vglut2a (reelin, n = 39 SINs in 4 larvae; vglut2a n = 79 SINs in 8 larvae). Scale bar (a–d) = 20 μm, (f, g) = 10 μm. A, anterior; L, lateral; M, medial; P, posterior. White hatched line indicates the neuropil and SPV boundary. Error bars, SEM