
|
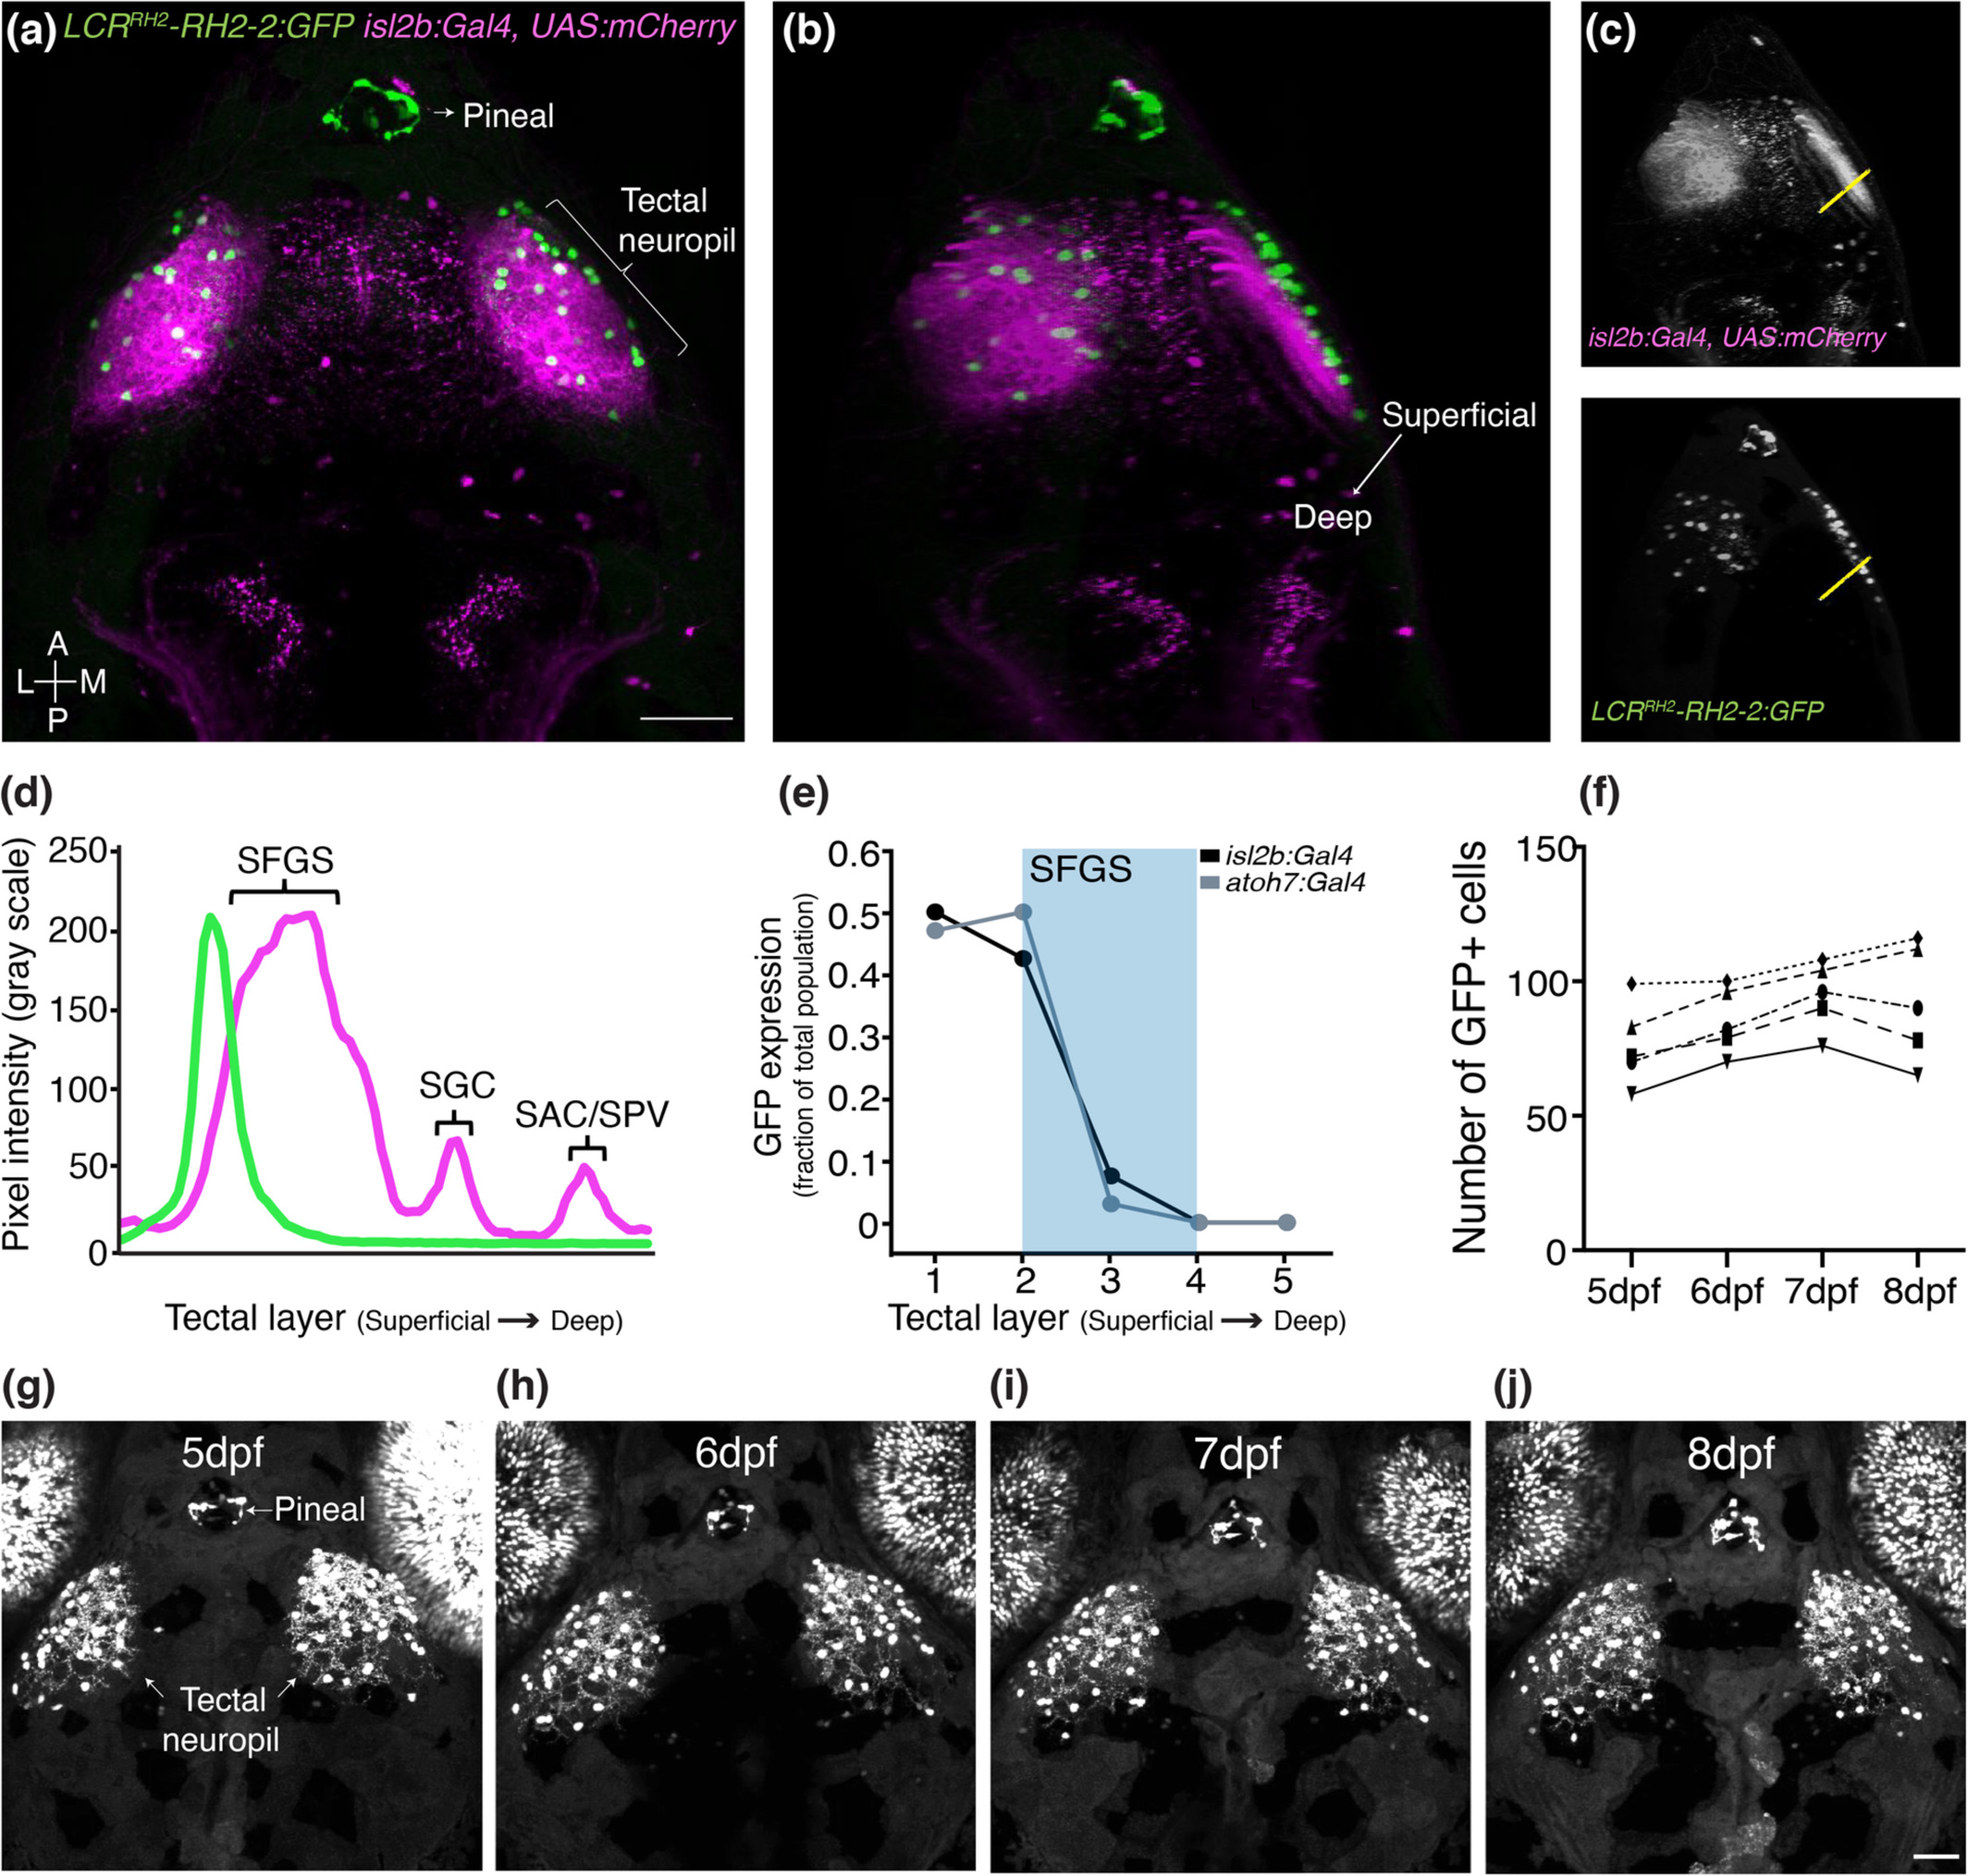
Fig. 6 SINs are strongly and stably labeled by the LCRRH2‐RH2‐2:GFP transgene. (a) Top view of a 7dpf isl2b:Gal4 × UAS:mCherry × LCRRH2‐RH2‐2:GFP larva. GFP expression is observed in putative SINs as well as in the pineal gland and a subset of photoreceptor cones. (b) Rotated confocal volume of the same larva shown in (a). Note LCRRH2‐RH2‐2:GFP+ SIN cell bodies (green) line are anatomically restricted to SO (RGC axons labeled by mCherry, magenta). (c, d) Fluorescence intensity profile measurements along the yellow lines shown in (c). mCherry signal peaks correspond to SFGS, SGC, and SAC/SPV. (e) GFP expression, analyzed across multiple larvae crossed to either isl2b:Gal4 or atoh7:Gal4 x UAS‐mCherry, shows that LCRRH2‐RH2‐2:GFP+ SINs are restricted to SO (n = 20 larvae for isl2b:Gal4, 18 larvae for atoh7:Gal4, 7 dpf). (f) Label of LCRRH2‐RH2‐2:GFP+ SINs is stable over time. Number of GFP+ cells shown in 5 larvae over for each developmental age, respectively. (g–j) A single LCRRH2‐RH2‐2:GFP larva at 5 dpf (g), at 6 dpf (h), at 7 dpf (i), at 8 dpf (j). Scale bars in (a, j) = 50 μm. A, anterior; L, lateral; M, medial; P, posterior. Error bars are SEM