
|
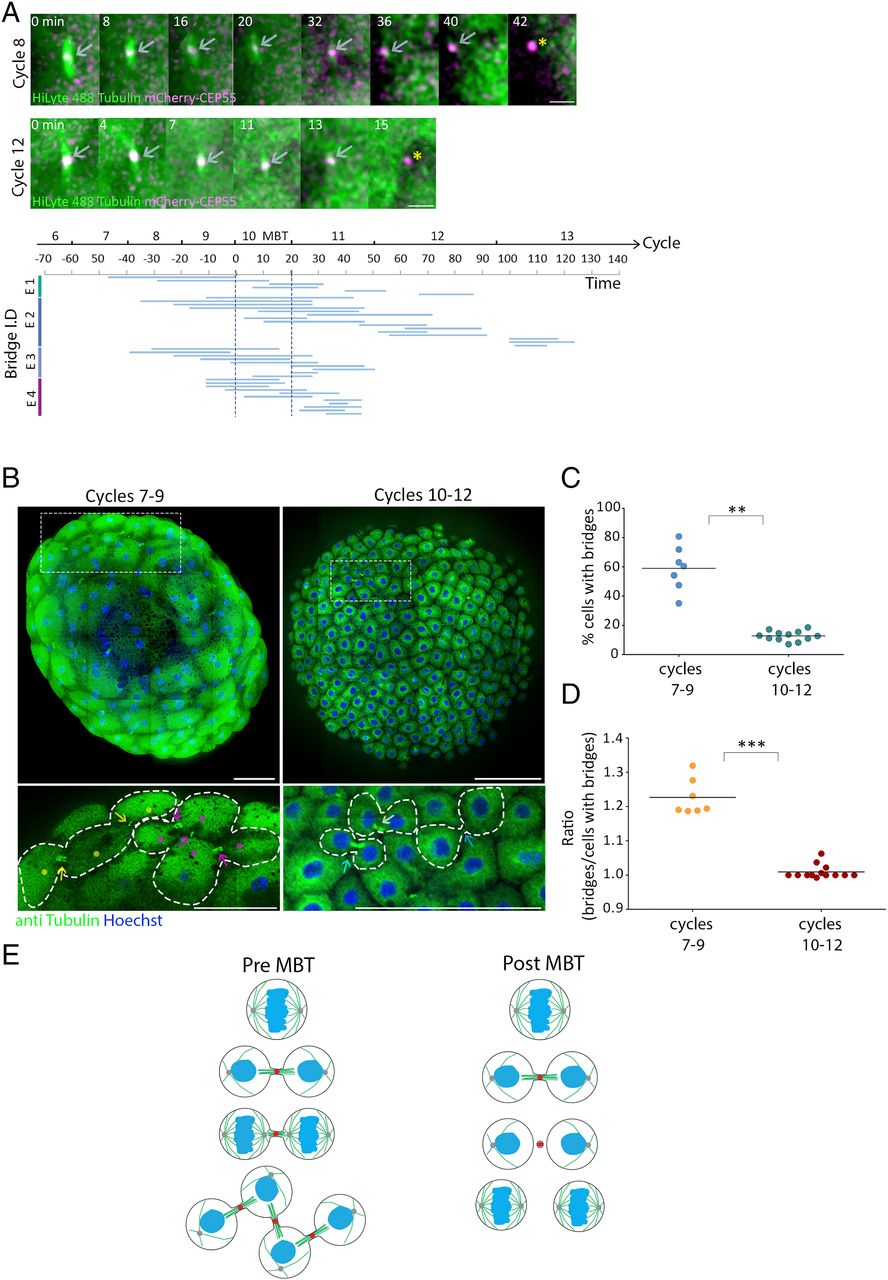
Fig. 3 Abscission is stalled until MBT in zebrafish embryos. (A) Embryos injected with mRNA encoding to mCherry-Cep55 (magenta) and HiLyte488-tubulin (green) were imaged live, and individual intercellular bridges were tracked and measured over time (as described in Fig. 1D). (Upper) Maximum intensity projection images (10 Z slices of 0.7 µm) of representative intercellular bridges formed pre-MBT (8th cell cycle) or post-MBT (12th cell cycle), as indicated. Gray arrows, intercellular bridges; asterisks, midbody remnants. (Scale bar, 5 µm.) (Bottom) The timeline of intercellular bridges obtained from single embryos in relation to MBT. Time 0, entrance to the 10th cell cycle. Each line represents an individual intercellular bridge (from formation to abscission). (B) Tile images of whole embryos fixed pre- (7th to 9th cycles) or post-MBT (10th to 12th cycles) and stained with anti-tubulin and Hoechst. Enlarged images of the regions in dashed rectangles in upper panels are shown on the bottom. Dots, cells; arrows, intercellular bridges; dashed lines, cells outline. Clusters of connected cells are labeled with similar colors. (Scale bar, 100 µm.) (C) Percentage of cells with intercellular bridges visualized in embryos fixed at the 7th to 9th cell cycles (average = 59% ± 12.21%, n = 7 embryos) and in the 10th through 12th cell cycles (average = 12.8% ± 3.43%, n = 12 embryos). The percentage of cells in late cytokinesis in pre-MBT embryos (7th to 9th cell cycles) is significantly higher than in post-MBT embryos (10th to 12th cell cycles) according to t test (t0.05,6 = 7.921, P = 0.002). (D) The ratio of intercellular bridges per cell at late cytokinesis was measured in pre- and post-MBT embryos and plotted on the graph. Averaged ratios for pre-MBT embryos = 1.009 ± 0.019 (n = 7 embryos); post-MBT embryos = 1.22 ± 0.048 (n = 12). Ratios in pre-MBT embryos are significantly higher than in post-MBT embryos (Mann–Whitney U test, U7,9 = 0, P = 0.0002). (E) Schematic model of intercellular bridge connection in pre- and post- MBT embryos. **P = 0.001 to 0.01, ***P = 0.0001 to 0.001.