
|
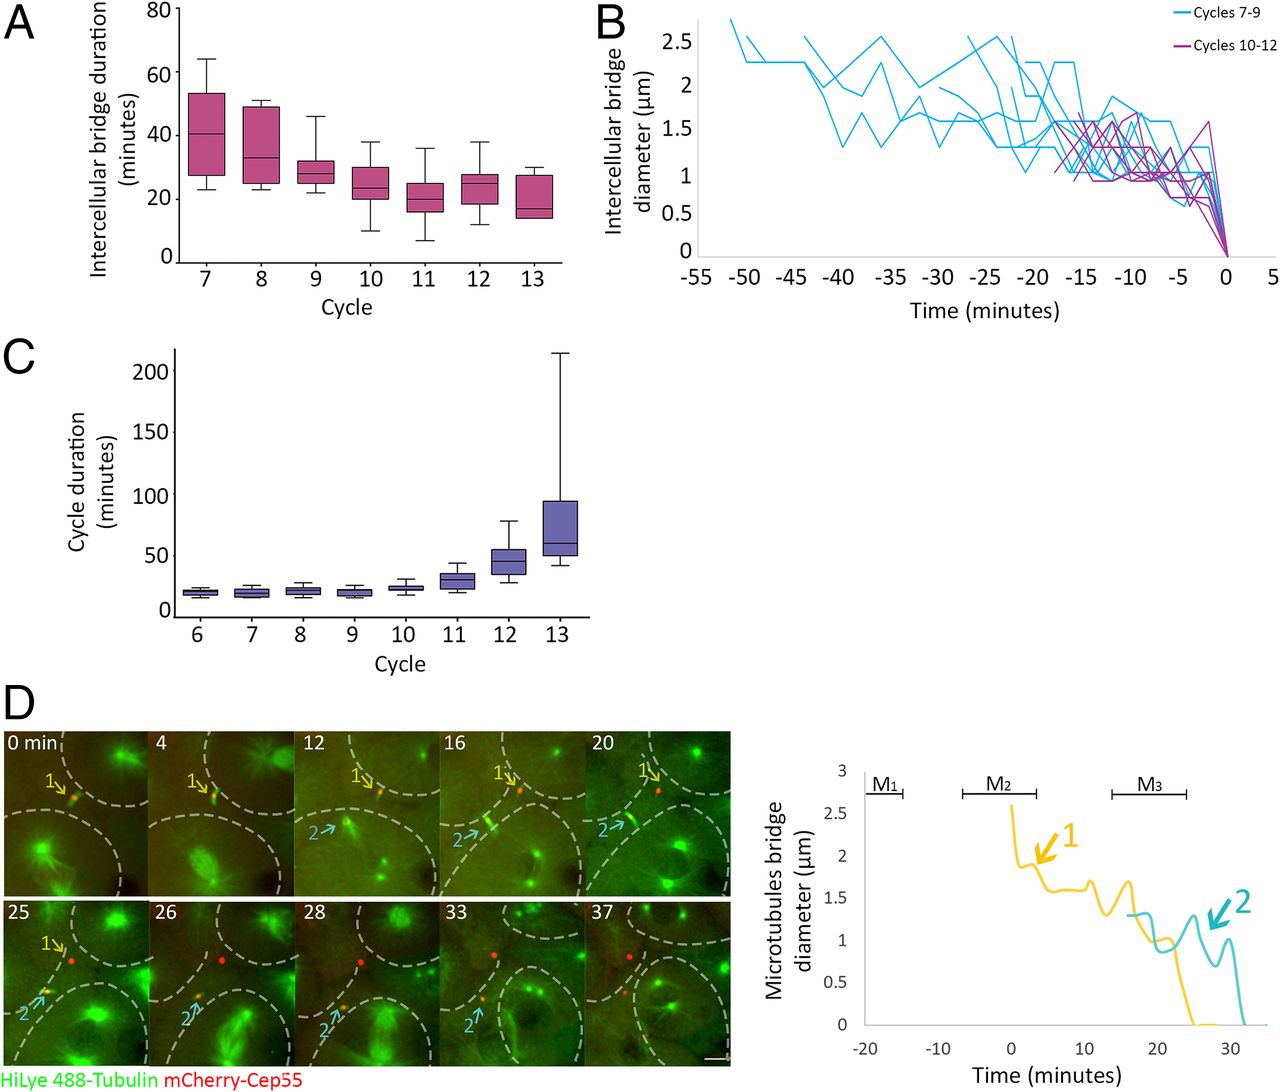
Fig. 2 Intercellular bridges persist for longer times in early cell cycles. (A) Averaged durations of intercellular bridges (measured based on Cep55 and tubulin signal, as described in Fig. 1D) formed at different cell cycles. n = 49 bridges, five embryos. Error bars, SD. (B) Intercellular bridge diameters measured in bridges that formed before (blue) or after (purple) the 10th cell cycle. Time 0, time of abscission. (C) Averaged cell cycle durations measured in embryos at different division cycles. Values were measured for individual cells, and averaged values obtained for each embryo were plotted according to the division cycle. n = 9 embryos; error bars, SD. (D) Live imaging of dividing cells in zebrafish embryos at the 8th to 10th cell cycles. Maximum intensity projections (30 Z slices at 1 µm) taken from selected time points of a representative embryo are shown (Movie S5). Microtubules, green; Cep55, red; intercellular bridges, arrows. Cells outlines are marked with dashed lines. The durations of two intercellular bridges observed in the movie sequence are plotted to the right. Colors in plot correspond to arrows in the movie sequence. Mitosis (M); numbers refer to bridge numbers (M1, bridge 1). n = 8 cells, five embryos. (Scale bar, 10 µm.)