
|
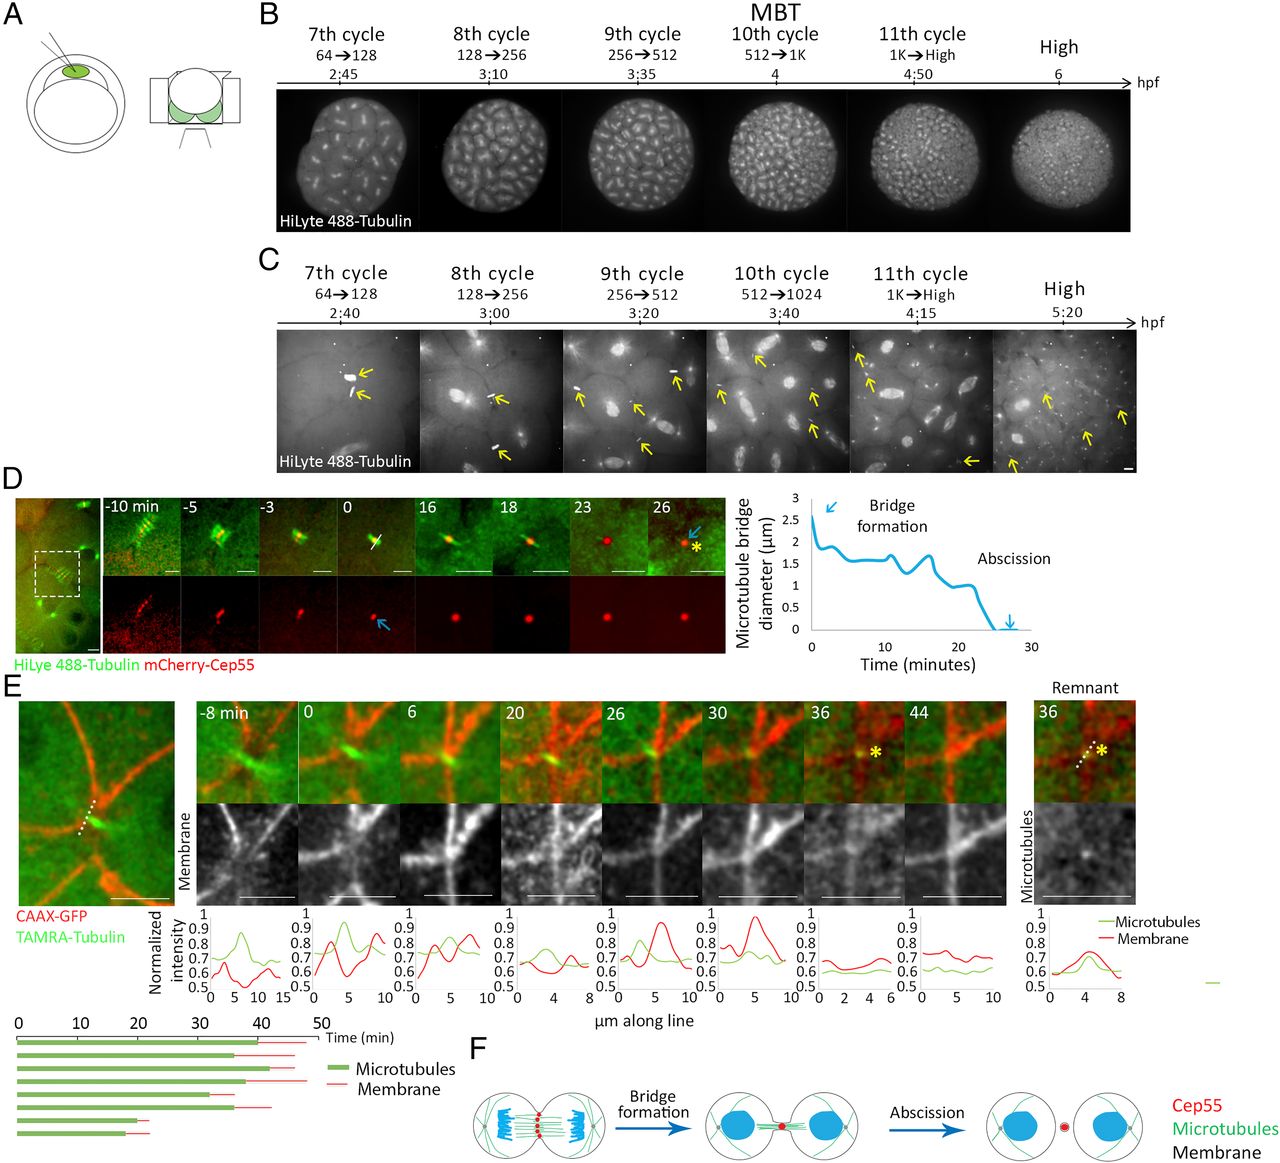
Fig. 1 Cytokinetic abscission in zebrafish embryos at blastula stage. (A) Schematic illustration of the experimental setup used to visualize abscission in live zebrafish embryos during blastula. One-cell-stage embryos were injected with mRNA encoding for specific proteins and with HiLyte 488-Tubulin (Left), dechorionized and mounted in custom-made agar chambers (described in Methods and SI Appendix, Fig. S1B) with the animal pole facing the coverslip, and imaged using an inverted spinning disk (Right). (B, C) Whole embryos (B) and intercellular bridges (C) visualized throughout blastula stage in live embryos. Shown are selected frames from time lapse movies demonstrating mitosis at 7th to 11th cell cycle stages using tubulin labeling. Maximum intensity projection (30 Z slices at 1 µm) is shown (Movies S1 and S2). (D) Representative time frames from live imaging recordings of an embryo at the 8th to 10th cell cycles injected with HiLyte488-tubulin (green) and mRNA encoding to mCherry-cep55 (red) (Movie S3). A zoomed-out image of the two dividing cells is shown to the left. Time 0, bridge formation, was set as the first time point at which a single microtubule stalk with a packed Cep55 puncta was observed. Formation of a midbody remnant (asterisk) was defined as the completion of abscission. Plot on the right: the diameter of the microtubule stalk was measured at the rim of the midbody from bridge formation (white line, time 0) and plotted through time. Blue arrows represent bridge formation and abscission events. This analysis was repeated for each of the intercellular bridges measured in this study. (Scale bar, 10 µm.) n = 18 bridges, five embryos. (E) Representative time frames from live imaging recordings of an embryo at the 10th cell cycle injected with TAMRA-tubulin (green) and mRNA encoding CAAX-GFP (red) (Movie S4). A zoomed-out image of the two dividing cells is shown to the left. Time 0, bridge formation; asterisk, midbody remnant. Line intensities along the line drawn in the zoomed-out image are plotted for each channel at the bottom of each image. Note that the microtubule stalk (single peak, red) is surrounded by a membrane tube (two peaks, green). Midbody remnant formation (asterisk) is accompanied by decreased tubulin signal at the location of the bridge. A continuous membrane staining is observed several minutes later, representing closure of the membrane tube. (Right) An image and a line intensity plot of the midbody remnant showing that the tubulin foci is surrounded by a membrane staining. (Bottom) Measurements of intercellular bridge durations based on microtubule signal (green) and membrane signal (red) as determined for individual bridges. (Scale bar, 10 µm.) n = 8 bridges, two embryos. (F) Schematic illustration of the major steps in cytokinesis in zebrafish embryos.