
|
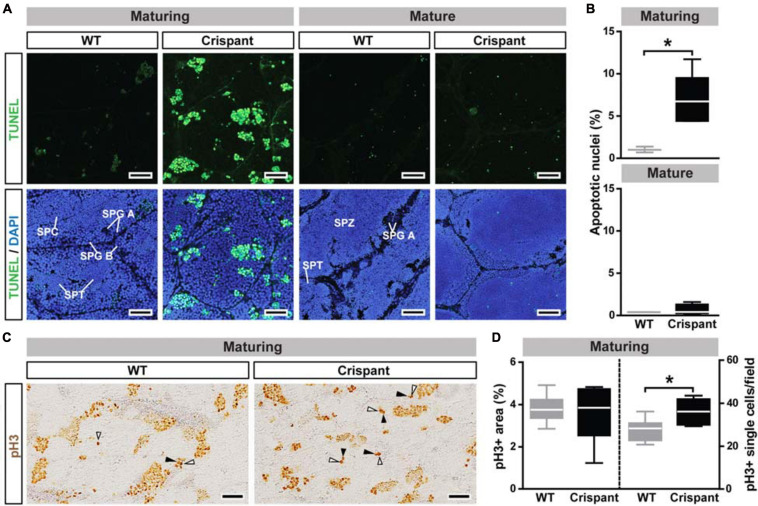
FIGURE 4 Germ cell apoptosis and proliferation in WT and stra8 crispant salmon testis tissue. (A,B) Detection (A) and quantification (B) of germ cell apoptosis/DNA damage by TUNEL analysis. TUNEL + cells/cysts are shown in green and DAPI counterstain in blue. Representative germ cell stages are labeled: type A spermatogonia (SPG A), type B spermatogonia (SPG B), spermatocytes (SPC), spermatids (SPT) and spermatozoa (SPZ). Scale bar, 30 μm. Quantification results are shown as mean ± SEM (N = 3–5; *p < 0.05). (C,D) Detection (C) and quantification (D) of cell proliferation by pH3 analysis. White and black arrowheads indicate pH3 + type A undifferentiated and Sertoli cells, respectively (examples of proliferating cells are shown at higher magnification in Supplementary Figure 4C). Scale bar, 50 μm. WT, wild-type; Crispant, stra8 crispant.