
|
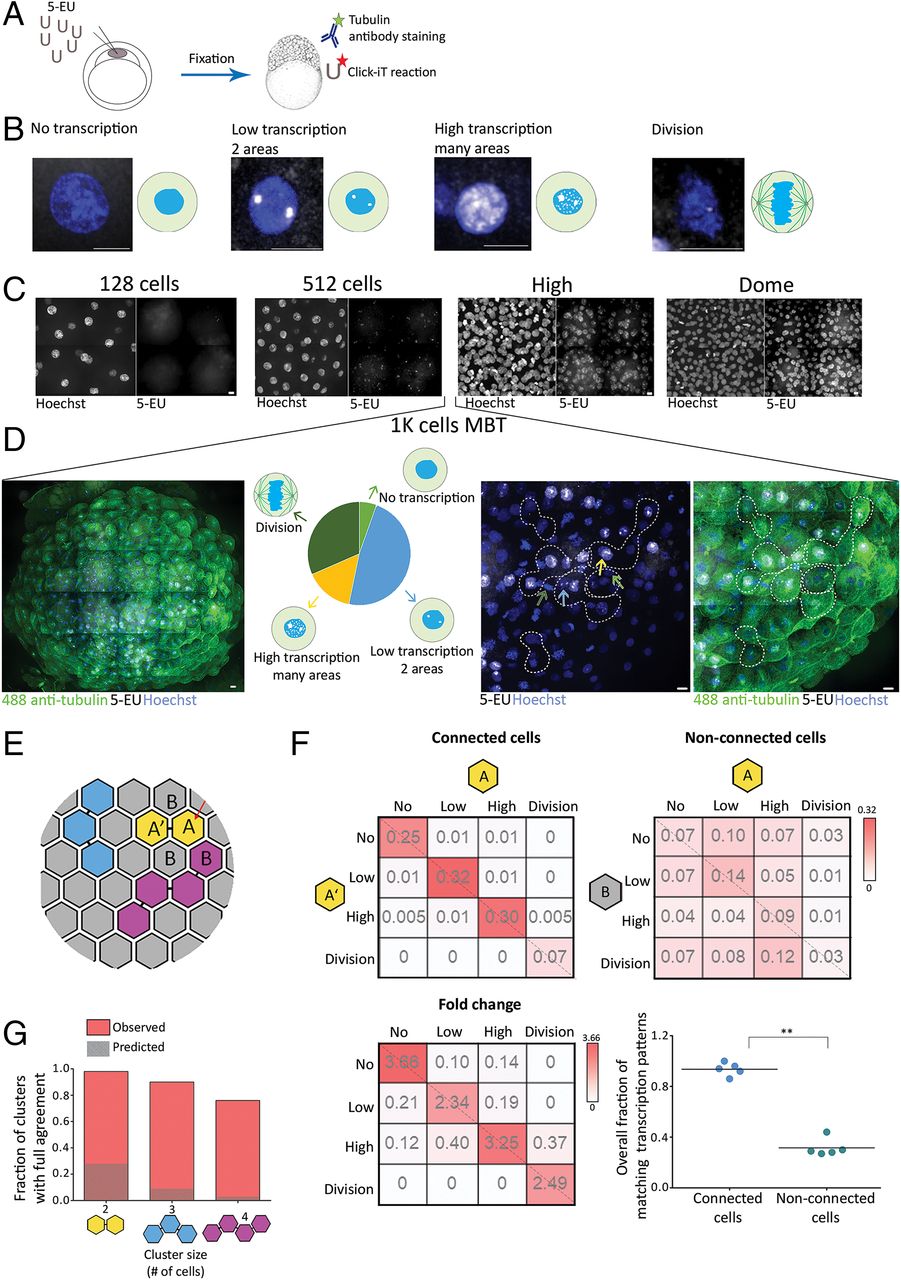
Fig. 5 Cells connected by intercellular bridges exhibit a similar transcription pattern. (A) A schematic illustration of the experimental setup. One-cell-stage embryos were injected with 5-ethynyl uridine (5-EU) and fixed at the indicated stages. Embryos were stained with anti-tubulin (for intercellular bridge detection) and Hoechst (for nuclear detection) and click-labeled using Alexa594-azide for detection of mRNA-incorporated 5-EU. (B) Single cells labeled with 5-EU (white) and Hoechst (blue), exhibiting the 5-EU labeling patterns observed in the embryos. Transcription patterns were classified into four different stages based on 5-EU labeling: no, low, high, and dividing cells (46). (Scale bar, 10 µm.) (C) Tile images of maximum intensity projection images (15 through 30 Z slices of 1 to 1.5 µm interval) of representative regions in embryos at the indicated developmental stages. n = 4–5 embryos from each stage. (Scale bar, 10 µm.) (D) Heterogeneous transcription patterns observed in embryos at MBT. (Far Left) A tile image of a representative embryo labeled with tubulin (green), Hoechst (blue), and 5-EU (white). (Middle Left) The relative distribution of the four transcription patterns (classified in B) observed in a representative embryo (no transcription, 5%; low transcription, 48%; high transcription, 15%; and dividing cells, 32%). (Middle Right and Far Right) Enlarged images of subset regions in the embryo with high levels of cell–cell variations in transcription patterns. Different transcription patterns are marked in arrows at different colors (corresponding to arrows in the Middle Left). Clusters of interconnected cells (marked in dashed lines) were identified based on tubulin staining and were used in the analysis described in E–G. (Scale bar, 10 µm.) (E–G) Quantitative analysis of the similarity in transcription patterns observed between connected and nonconnected cells. (E) Schematic representation of an embryo at MBT. Connected cells are filled with similar colors; letters correspond to the matrixes presented in F. (F) Resemblance matrix of transcription patterns of embryos at MBT. (Top) Pairs of connected (Left) and nonconnected (Right) cells (A, A′, and A, B, respectively) were scored according to their transcription pattern, and the fraction of specific combinations of transcription patterns between cell pairs was plotted in the matrix. Color indicates probability. Data were pooled across five embryos (206 connected and 768 nonconnected cell pairs). (Bottom Left) The fold change increase in fraction of connected versus nonconnected cell pairs. (Bottom Right) The accumulated probability of agreement in transcriptional patterns in connected versus nonconnected cell pairs (values were calculated independently for each embryo, n = 5). Connected cell pairs obtained a significantly higher transcriptional agreement compared to nonconnected pairs (0.94 ± 0.05 versus 0.32 ± 0.07, respectively; Mann–Whitney U test, U5,5 = 0.8, P = 0.003). (G) Clusters of two, three, and four connected cells were scored for matched transcription patterns such that only clusters in which all cells exhibited a similar transcription pattern were considered as clusters with intracluster agreement (red bars). Values were compared to simulated data, generated as described in SI Appendix, Supplementary Methods (dashed bars). Two-cell clusters (n = 150), 98.6% versus 28%; three-cell clusters (n = 30), 90% versus 9.1%; four-cell clusters (n = 12), 76.9% versus 3.1%. **P = 0.001 to 0.01.