
|
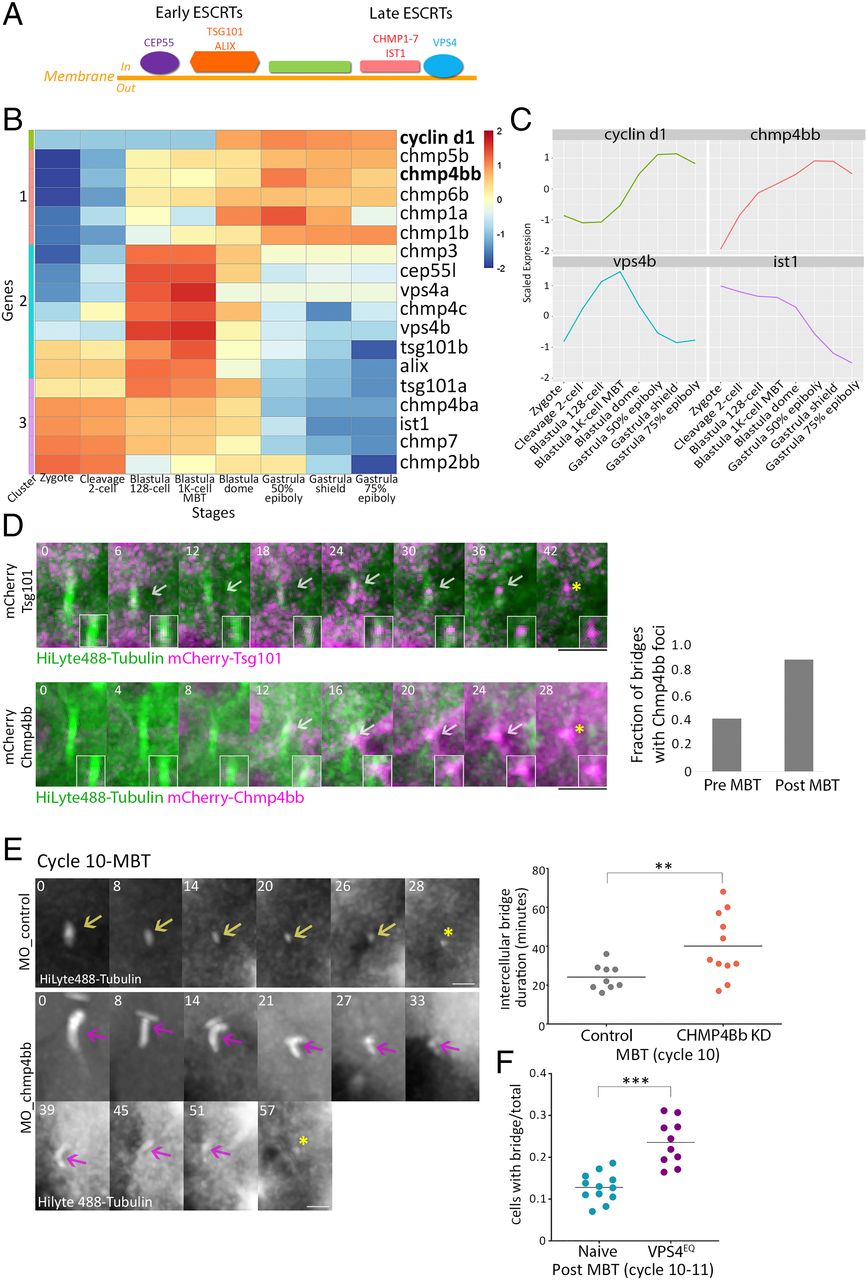
Fig. 4 ESCRT proteins are involved in abscission during zebrafish embryogenesis. (A) Schematic representation of the canonical ESCRT cascade. Early ESCRT proteins, such as CEP55, ALIX, and TSG101, recruit late ESCRTs (CHMP1-7 and IST1) and VPS4 to the inner side of the plasma membrane where scission occurs. (B) Hierarchical clustering of the expression levels of the zygotically activated gene cyclin d1 and 17 ESCRT genes taken from RNA sequencing data from eight developmental stages [downloaded from White et al. (41)]. Rows, individual genes; columns, developmental stages. Colors in the heatmap indicate the expression levels of each gene across the samples relative to its mean expression and trimmed to range [−2, 2] (SI Appendix, Fig. S3B for raw data). Clusters 1–3, color coded to the left of the heatmap, are based on expression patterns. (C) Normalized mRNA levels obtained for Cyclin d1 and representative ESCRT genes plotted through time. x-axis, developmental stages; y-axis, normalized expression levels. (D) Embryos were injected with mRNA that encodes for Tsg101 (Upper) or Chmp4bb (Bottom), fused to mCherry (magenta) and with HiLyte 488-Tubulin (green). Shown are maximum intensity projection images of subvolumes of the cells that include the intercellular bridge (10 through 25 Z slices of 0.7 µm intervals) taken from time lapse movies of representative cells imaged in embryos at the 12th cell cycle. Both proteins localized to the intercellular bridge (gray arrow) and were detected in the midbody remnants after abscission (asterisks). Time 0, bridge formation. (Insets) Zoomed-in images of the midbody. (Scale bar, 10 µm.) (Right) A fraction of intercellular bridges exhibiting chmp4bb localization in pre- and post-MBT of embryos. Tsg101, n = 8 bridges, two embryos; chmp4bb, n = 46 bridges, three embryos. (E) Embryos were injected with morpholino oligos (control or Chmp4bb specific), and intercellular bridges were recorded through time in embryos at the 10th cell cycle. Shown are maximum intensity projection images (6 through 10 Z slices of 1 µm interval) taken from movies of representative intercellular bridges (Movie S7). Asterisks, midbody remnant. (Scale bar, 5 µm.) (Right) Intercellular bridge durations measured for individual intercellular bridges (as described in Fig. 1D) in control and knockdown (KD) embryos. Averaged bridge duration in Chmp4bb KD embryos = 40.09 ± 16.82 (n = 11 bridges, five embryos); in control embryos, averaged bridge duration = 24.11 ± 6.47 min (n = 9 bridges, three embryos). Intercellular bridge duration was significantly longer in Chmp4bb KD embryos compared to control embryos (unpaired t test with Welch's correction for unequal variances, t0.05,13 = 2.9, P = 0.012). (F) Percentage of cells with intercellular bridges in embryos at the 10th to 12th cell cycles (post-MBT). VPS4EQ-injected embryos had a significantly higher ratio than naive embryos (unpaired t test with Welch's correction for unequal variances, t0.05,14 = 2.9, 5.48, P < 0.0001). n = 22 embryos. **P = 0.001 to 0.01, ***P = 0.0001 to 0.001.