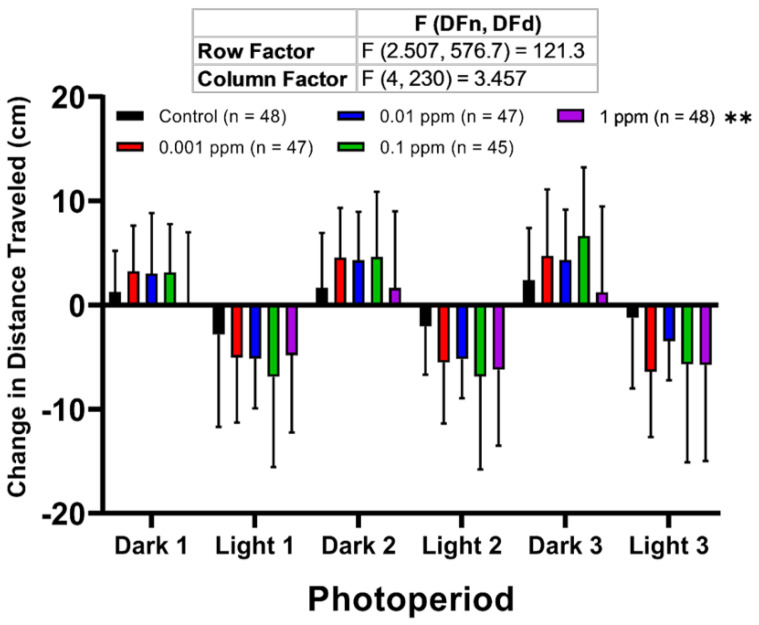
Figure 3 Comparison of the larvae photomotor response (LPMR) for zebrafish larvae after treated with different doses of arecoline. LPMR of 120 hpf zebrafish after 1-day exposure of 0 ppm (black), 0.001 ppm (red), 0.01 ppm (blue), 0.1 ppm (green), and 1 ppm (purple) arecoline. Three LPMRs were measured. The data are expressed as means ± SD of total distance travelled of each following period. Data were analyzed by two-way ANOVA with the Geisser-Greenhouse correction. Each treated group was compared with the control group (n = 48 for the control, 0.01 and 1 ppm arecoline groups; n = 47 for 0.001 ppm arecoline group; n = 45 for 0.1 ppm arecoline group, ** p < 0.01).
Image
Figure Caption
Acknowledgments
This image is the copyrighted work of the attributed author or publisher, and
ZFIN has permission only to display this image to its users.
Additional permissions should be obtained from the applicable author or publisher of the image.
Full text @ Toxins (Basel)

