
Image
|
Figure Caption
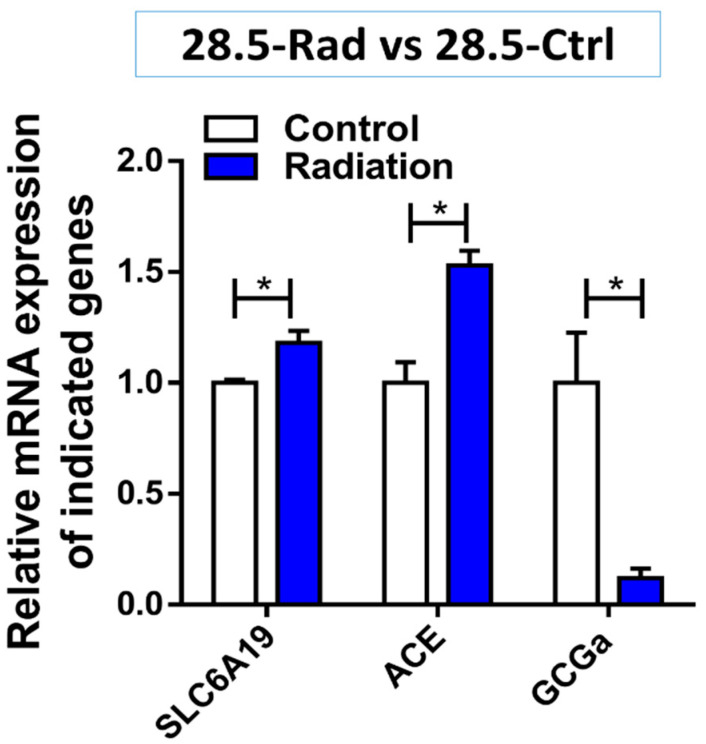
Figure 7 Gene expression in the radiation (28.5-Ctrl) group compared with control (28.5-Ctrl). The figure shows the increase in expression of SLC6A19 transporter (p = 0.041) and the angiotensin system gene ACE (p = 0.022) while GCGa involved in increasing blood sugar levels is downregulated (p = 0.032) compared to the control. * p < 0.05.
Acknowledgments
This image is the copyrighted work of the attributed author or publisher, and
ZFIN has permission only to display this image to its users.
Additional permissions should be obtained from the applicable author or publisher of the image.
Full text @ Cells