
Image
|
Figure Caption
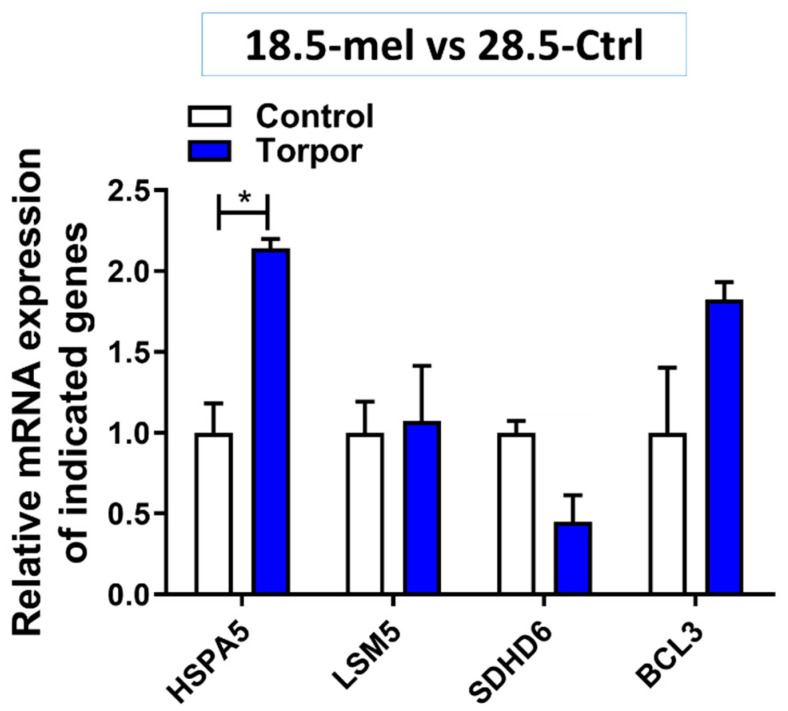
Figure 3 Gene expression in the torpor (18.5-mel) group compared to that in the control (28.5-Ctrl) group. The figure shows the relative increase in expression of HSPA5 (p = 0.013) and while not significant BCL3 expression (p = 0.107) is also increased. It also demonstrates an almost significant decrease in expression of SDHD6 (p = 0.05) compared with control, supporting the results from DE analysis. * p < 0.05.
Acknowledgments
This image is the copyrighted work of the attributed author or publisher, and
ZFIN has permission only to display this image to its users.
Additional permissions should be obtained from the applicable author or publisher of the image.
Full text @ Cells