
Image
|
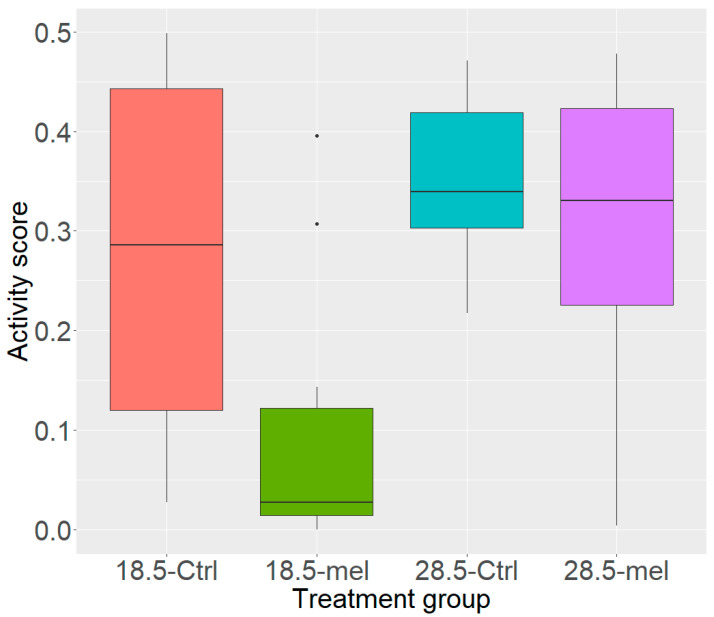
Figure Caption
Figure 2 Activity Scores. The control group (28.5-Ctrl) inhabited all areas of the beaker. The torpor group (18.5-mel, q = 0.002) had a significantly lower activity score than either control or temperature group (28.5-Ctrl, 18.5-Ctrl, q = 0.030). Lowering temperatures alone (18.5-Ctrl, q = 0.030) reduced activity while the melatonin group (28.5-mel, q = 0.538) did not significantly reduce activity.
Acknowledgments
This image is the copyrighted work of the attributed author or publisher, and
ZFIN has permission only to display this image to its users.
Additional permissions should be obtained from the applicable author or publisher of the image.
Full text @ Cells